

Welcome to this week’s Forex Forecast. It’s shaping up to be a volatile stretch. With the RBA rate decision on September 30 and U.S. non‑farm payrolls on deck, markets are primed for fireworks. In today’s breakdown, Nikkhil has sliced through the noise to map out setups on the Dollar Index, AUDJPY, Bitcoin and XAUUSD(Gold). Let's dive in.
USD / Dollar Index (DXY)
Over a three‑monthly frame, DXY rallied into the 78.6 - 85.4 Fibonacci zone before stalling and printing a lower high. That initiates a sequence of lower lows, underlined by a bearish leaning MACD histogram. Drawing a downward fib extension from the peak through the subsequent low confirms that the index is seeking a strong magnet support area below. Resistance is now focused around the 100 to 101.13 zone.
Dropping to the weekly timeframe, price has turned into a corrective retracement after testing support, we see a pullback higher, challenged at the 23.6 retracement around 99.76. There’s bullish divergence between the swings, arguing that this bounce has room to run in the short term, before a resumption of downside pressure.
On the daily chart, a clear double bottom with bullish divergence has formed, and the structure break level aligns again at 99.76. Once that zone is cleared, the path toward 101.13 opens. Meanwhile, an aggressive confirmation through a trendline break has already played out, pushing price into a resistance cluster that could trigger a brief pullback before DXY resumes higher. On the 4‑hour and hourly frames, the uptrend holds via higher highs and higher lows - though minor divergences hint at a near-term dip.
Plan: Expect a short-term drop first, then another push higher to finish the retracement, unless DXY breaks below 97.0 (97.02–97.11), which would spoil the bullish corrective structure.

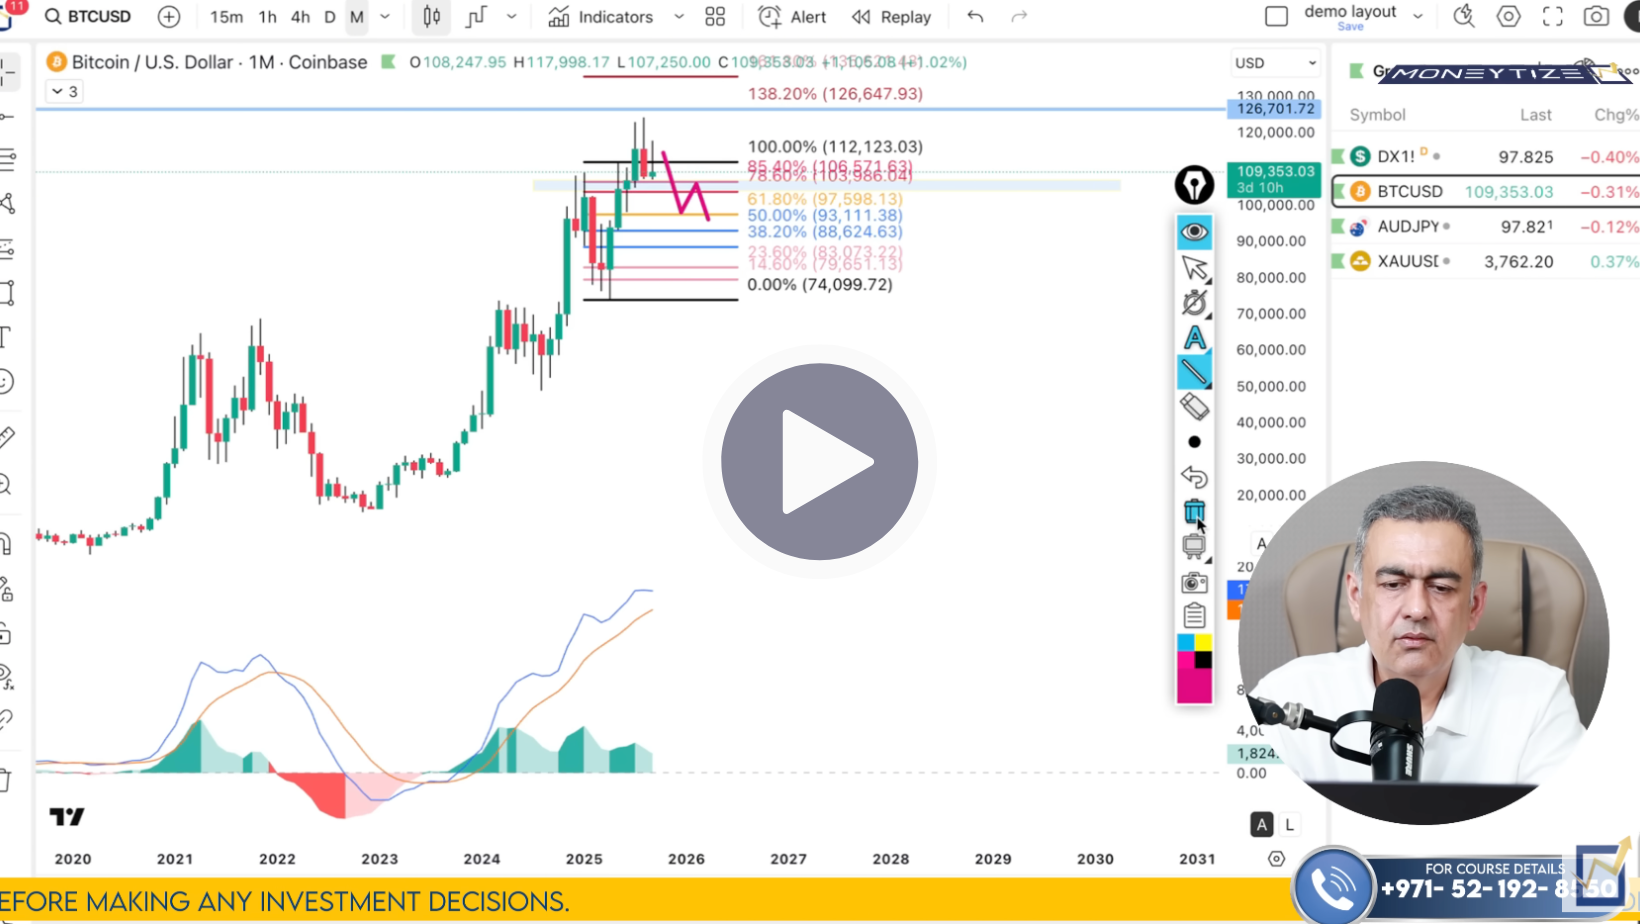
Bitcoin (BTCUSD)
On the three‑monthly timeframe, Bitcoin’s momentum remains staunchly bullish. A reverse fib from the prior completed candle suggests the next extension target is $126,647, with support zones forming between $103,000 - 106,500. So long as price stays above $104,000 on a closing basis, a deeper retracement is unlikely.
But on the monthly chart, bullish momentum is weakening. Histogram strength is softening, lines are converging, yet we need a confirmed close below $104,000 before assuming a more meaningful dip. On the weekly scale, price is under pressure: despite higher highs, we see bearish divergence across both histogram and lines. Price is now trading below the 23.6 retracement ($109,955), and action could gravitate toward $104,000. If that breaks, downside stretch is toward $94,000, and in extreme extension, as low as $87,000.
Daily and 4‑hour charts reflect this pressure: structure has broken, a lower high is forming, and bearish extensions point to $102,000 as an interim target. Given the underlying bullish higher timeframes, Nikkhil views any weakness now as a buying opportunity, accumulation on the dip toward $102,000, then eyes back on $126,700 and beyond (potential next target $135,800+).
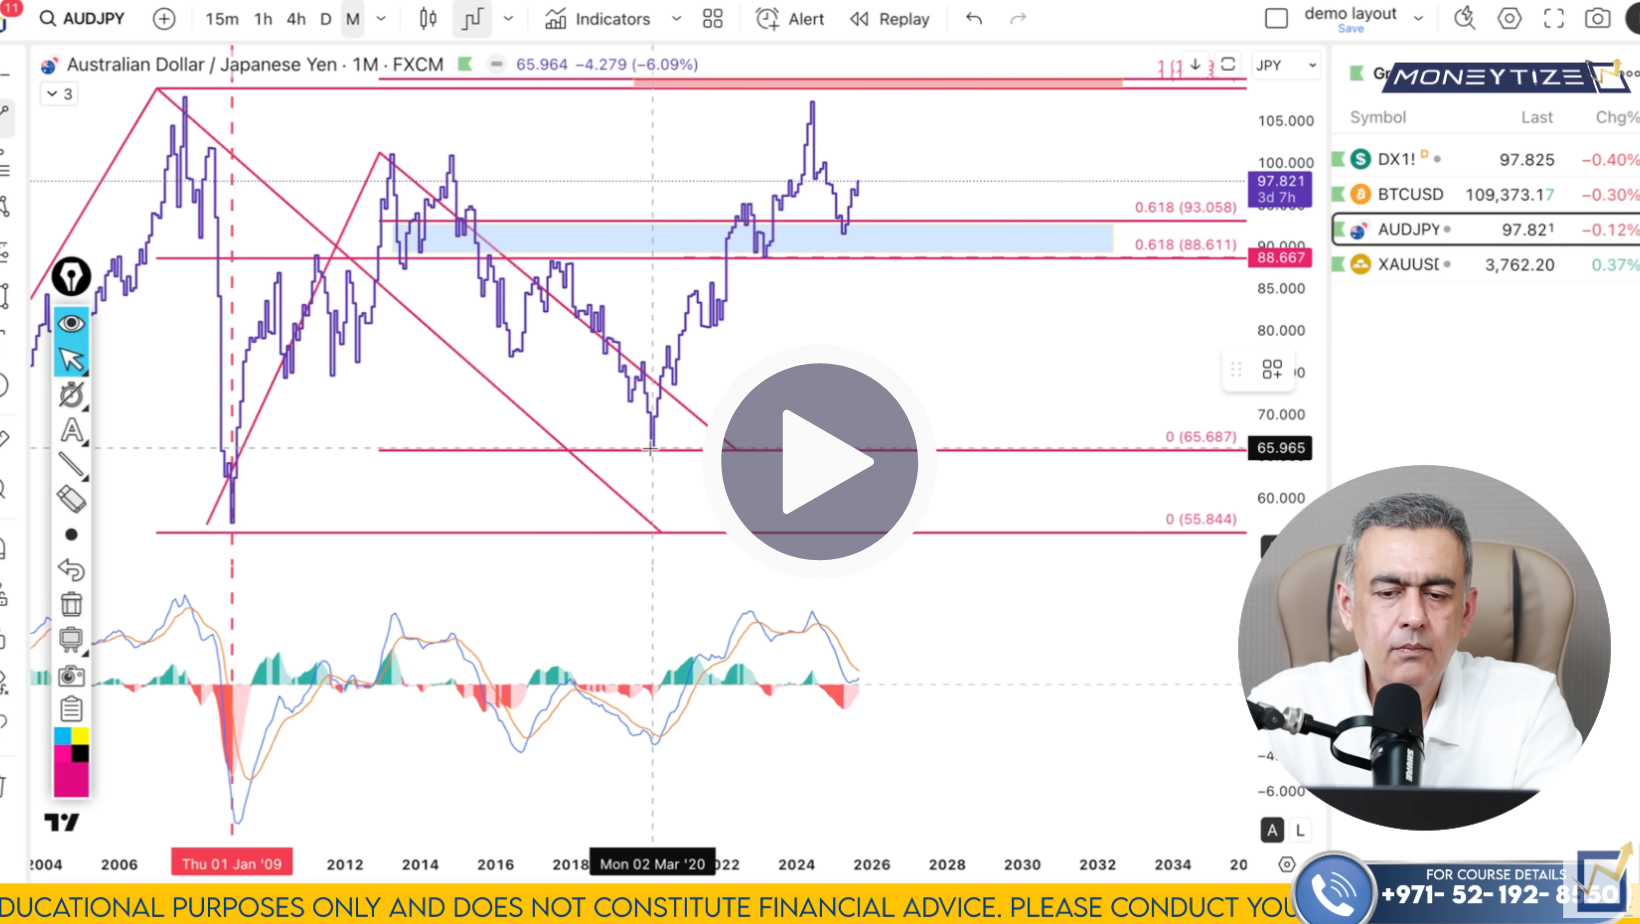
AUDJPY
From a monthly lens, AUDJPY carved out a bullish divergence, then broke structure. Initial fib extensions project upside, while recent momentum wanes, revealing increasing risk of pullbacks. On the monthly and weekly frames, exhaustion on the histogram is evident, warning of a short‑lived reversal before continuation.
On the daily chart, a higher high already printed with bearish divergence on MACD lines. The ideal trigger is a break of structure (88.61) or trendline failure, paving the way downward. On the 4‑hour view, corrective retracements in the 78 - 85 zone align with new lower highs, with extension geometry pointing toward 97.5 (in the context of that frame). The current 1‑hour chart is more bearish: sellers are stepping in after weak rallies, lower highs forming, and the trend tipping downward. Short entries here (stop above 98.15) targeting 96.07 seem preferred.
In the short term, bearish is the lean for AUDJPY, but if we see a deeper pullback into a magnet support zone, medium-term longs could be revisited.
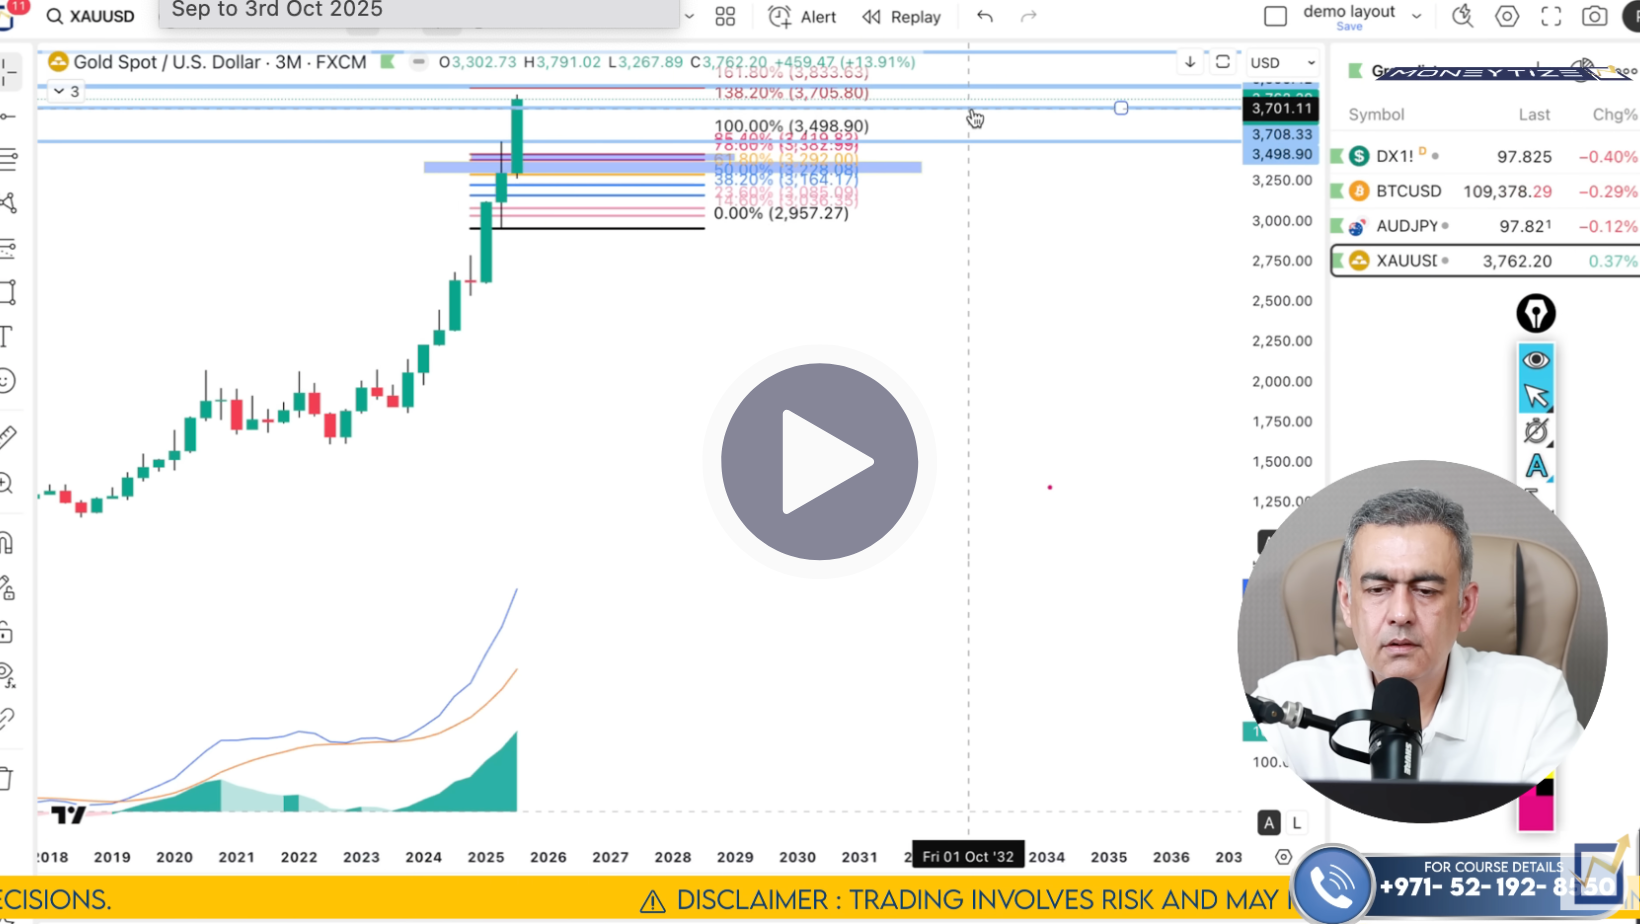
Gold (XAUUSD)
This is the one everyone’s talking about, and rightly so. From the six‑monthly down to weekly charts, the trend in gold remains decisively bullish. We see higher highs across MACD lines and histogram, with no confirmed signs of reversal in the bigger frames. Fib extensions measured from major lows point toward targets from $3,843 up to $4,055, with prior support zones in the $3,300 - 3,500 region serving as structural anchors.
Zooming into monthly, three‑monthly, and daily timeframes, gold continues to hold that bullish structure. On the daily chart, we find key support between $3,690 - 3,705 and immediate resistance near $3,789. In fact, gold rallied this week into the $3,791 zone — nearly matching our fib extension target, before stalling. That makes the double‑top formation suspicious, especially given reduced momentum (converging MACD lines). However, we don’t yet see confirmed divergence, so reversal judgments must wait for price action confirmation.
At the 4‑hour level, the last up‑leg is retracing, with resistance around $3,777 - 3,781 and support around $3,740 - 3,745. A clean break below $3,740 would be the first real crack, opening a path toward $3,690 or deeper. But barring that, gold looks poised to extend above resistance into the $3,805 - 3,817 zone, and potentially toward $3,833.
Plan: Buy on dips, preferably down to $3,740 or into the $3,690 zone (if we get a stronger break) - targeting $3,805 → $3,833, and longer term $3,950 → $4,055. If gold breaks decisively below $3,690, then the scenario shifts toward deeper retracement.
We’re heading into a week where gold’s recent rejection can’t be ignored, and USD strength or weakness (depending on NFP) can swing the pendulum. DXY is consolidating in a corrective bounce, bitcoin is softening but still bullish on the higher frames, AUDJPY shows short‑term bearish lean, and gold is stuck in a delicate balance of power between bulls and bears.
Here’s how Nikkhil is approaching this:
Click here to watch the full Moneytize Forecast
We’ll talk soon
Team Moneytize