

Welcome to this week’s forecast. We’ve got a heavyweight event on the cards. Fed Chair Jerome Powell speaking Tuesday, September 23rd, which could tip the balance between the dollar and gold. If the dollar moves up sharply, gold is likely to correct lower. If the speech weakens dollar sentiment, gold could find some lift. Beyond that, we've got several major themes unfolding in USD yields, DXY, EURUSD, Ethereum, NASDAQ, and Gold. Nikkhil has mapped them out, here’s how you can navigate them with clarity and readiness.
US Treasury Yields & the Dollar Index (US10Y / DXY):
US10Y has formed a bullish divergence over its recent lows and pulled off a breakout. From the monthly frame, the resistance area lies between 78.6% - 85.4% fib retracement, and it’s stalled there. Weekly and daily frames show support at 3.98 but also suggest a likely move back toward 3.50 in the medium term. In short: yields are likely to drop after a short‑term bounce.
That bearish setup in US10Y feeds into the Dollar Index (DXY). Long‑term extensions suggest DXY may be heading into the 82.60 - 83.60 range eventually, unless it can break above 100.39 to 101.27. For now, we’re seeing signs of short‑term strength: a bottom has been retested, a V‑shaped pattern on the 4‑hour chart has formed, and DXY has reclaimed the 23.6% retracement level from its recent drop. So expect a bounce toward 97.66 or maybe higher. Any move above 100 would be needed to challenge the bearish longer‑term narrative.

Ethereum (ETHUSD):
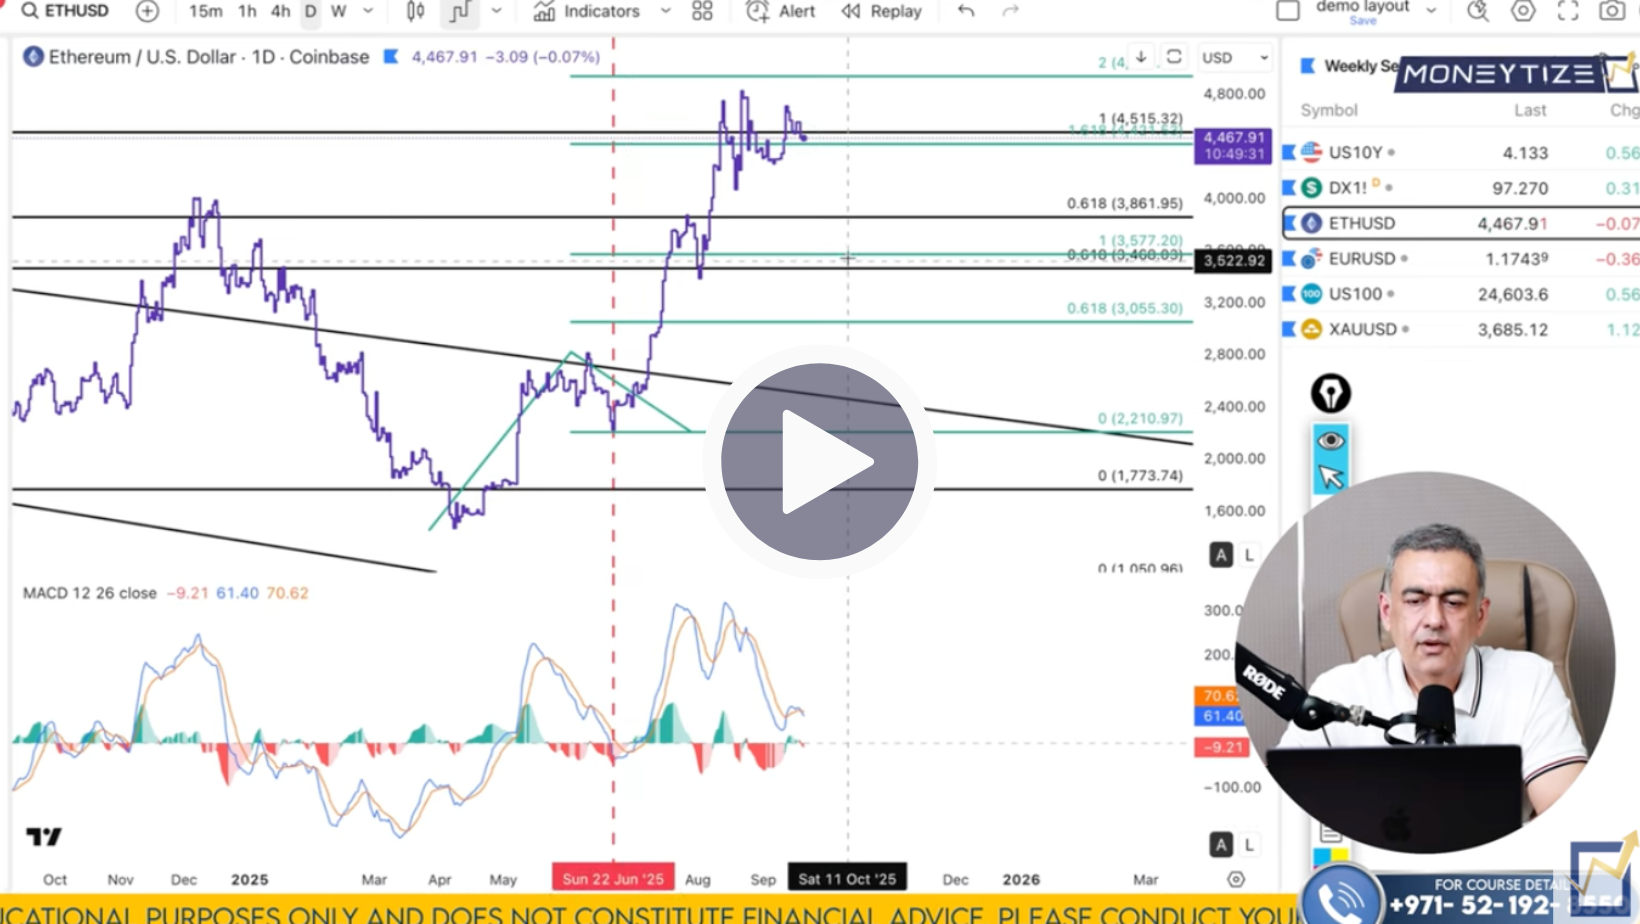
Ethereum remains bullish in the long term: the monthly frame shows rising cycles with no bearish divergences yet. Key resistance around $4,500 - 4,515, with targets up toward $5,600 - $5,800 over a longer time horizon.
In the short term, though, things look precarious. On the daily and 4‑hour frames we’re seeing bearish divergence following a new high, and trend‑line structure is weakening. The first major support lies near $4,400, then deeper toward $4,178, or even $3,861 - $3,815, if selling pressure ramps up. So if sellers push ETH down below $4,069, we may see a drop into those lower zones, but if ETH holds above that, it still has upside potential.
EURUSD:
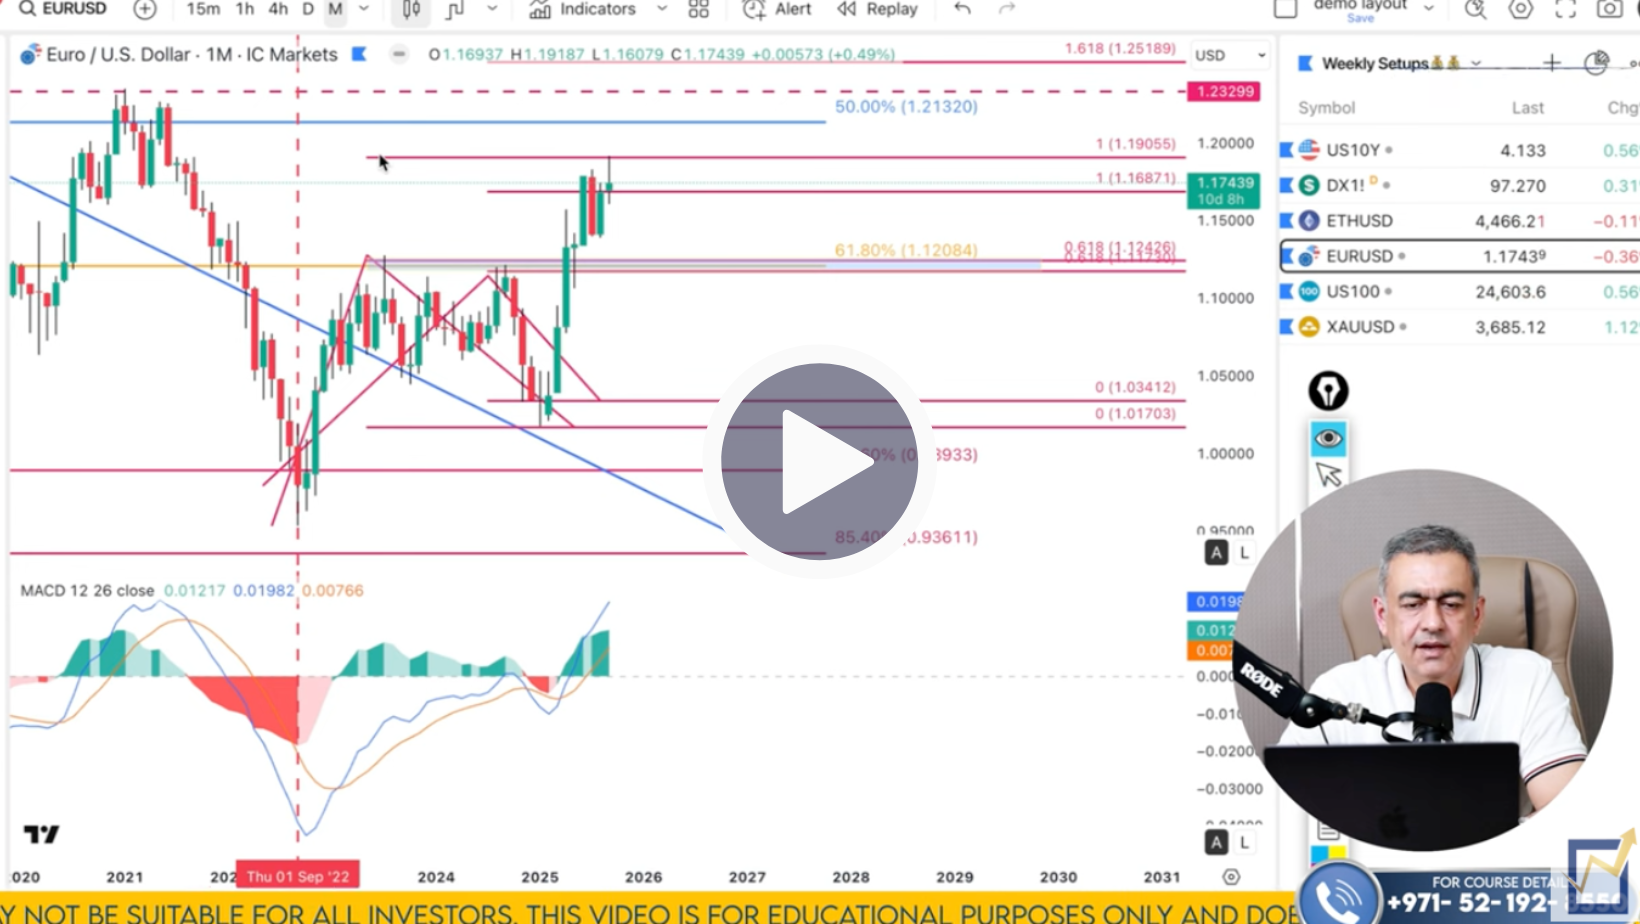
EURUSD is behaving like the inverse of DXY, naturally. On longer timeframes, we saw support in the 78.6 - 85.4% fib zone, underpinned by bullish divergence. Recently, EURUSD pushed up, hit resistance around 1.1905, and got rejected.
Now on the weekly & daily frames, the rising trend line has been breached, and the MACD histogram is turning negative. That signals weakening upside momentum and sets the stage for possible bearish continuation. Short‑term resistance remains near 1.1905, only a break above 1.1850 or so would call into question the bearish view. But supports to watch: 1.1687, 1.1624, and if weakness accelerates, down toward 1.1500 or deeper.
NASDAQ (US100):
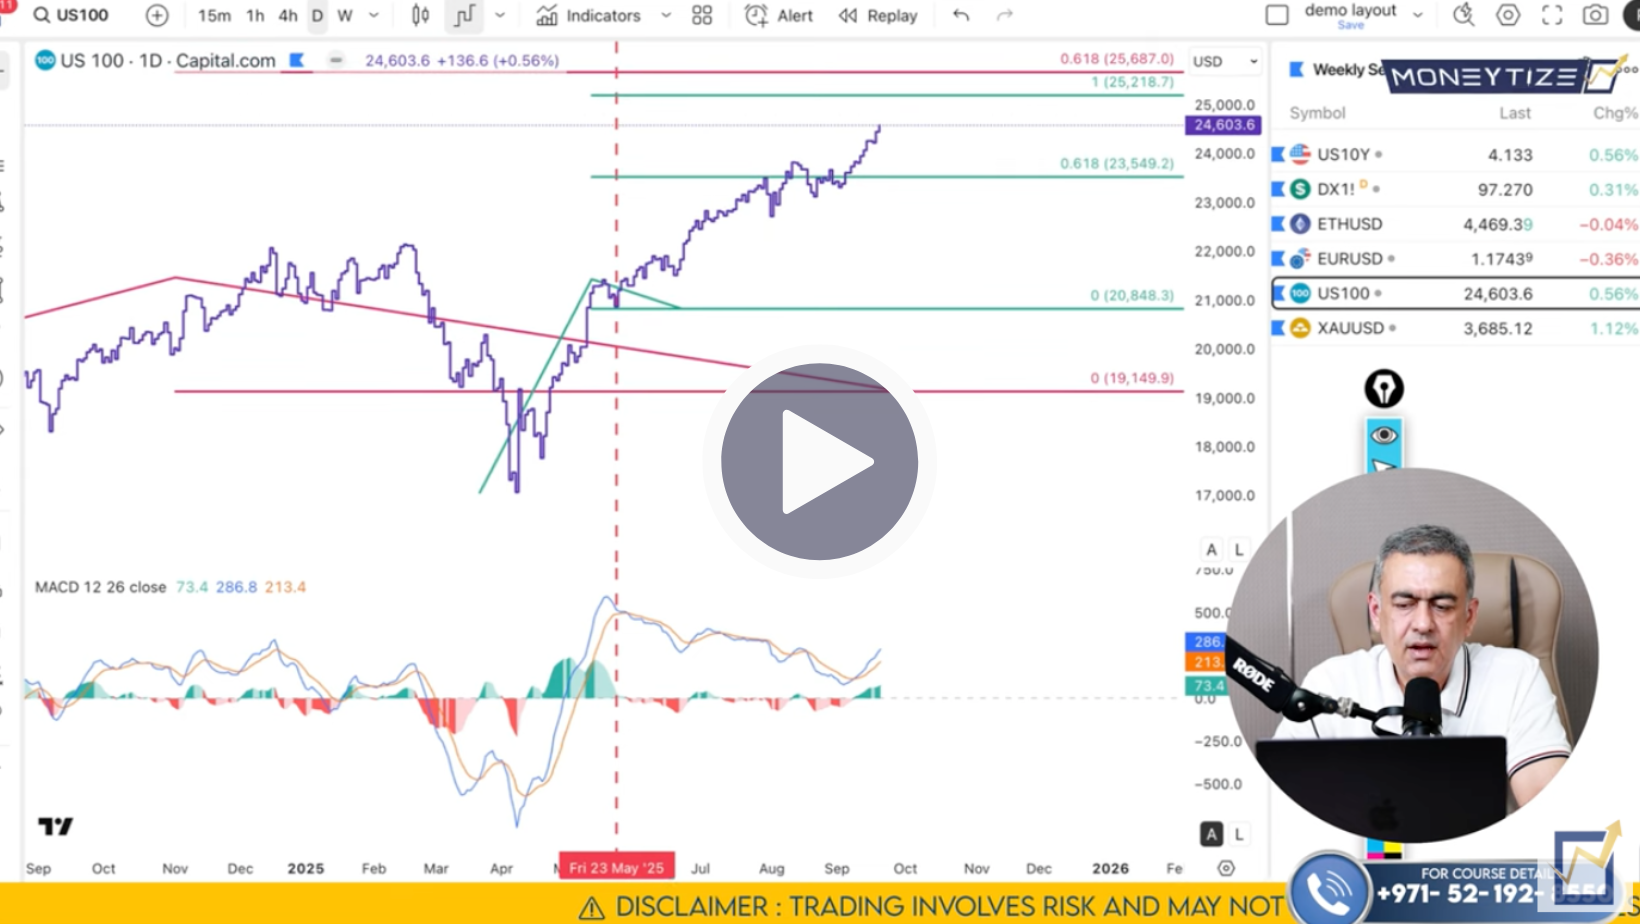
NASDAQ’s structure is clearly bullish. On the monthly and weekly frames, momentum remains intact. Key support has formed around 24,250, while resistance zones are building near 25,200 - 25,400, with the next larger target being about 25,687.
On shorter timeframes, any dips toward support (24,130 - 24,250) look like buying opportunities. Rejection from resistance could offer lower‑risk entries. Provided the longer‑term structure holds, upside remains favored.
Gold (XAUUSD):
Gold’s long‑term picture is bullish. On multi‑monthly frames, extensions target levels like $4,321, though that’s many months out. Weekly chart resistance is between $3,683 - $3,715, which is proving to be a magnet.
On daily, momentum is cooling: MACD histogram has lightened, showing buyers are tiring. On the 4‑hour frame, we’ve seen a bearish divergence and a compromised rising trend line. Thus, gold is under pressure. A short‑term bounce above 3715 is possible, but unless gold breaks out strongly above that zone, it looks likelier to correct to supports around $3,653, 3,618, and in a more extended move $3,451 - $3,461.
So while gold remains a long‑er term bullish play, for the coming week caution is warranted. Any buy should be intraday and modest from current levels; risk of reversal is high.

Here’s what Nikkhil is tracking:
Stay patient, read the reaction to Powell’s speech carefully, and use clean trigger zones and don’t force trades.
Click Here To Watch The Full Moneytize Forecast
We’ll talk soon
Team Moneytize