

Welcome to this week’s Forex Weekly Forecast for 27th to 31st October 2025. It’s shaping up to be another high‑volatility week. With policy decisions from the Federal Reserve, the European Central Bank and the Bank of Japan all on the calendar, Nikkhil has mapped the key zones across dollar, euro, pound, oil and gold to help you enter with clarity and conviction. Below are his instrument‑by‑instrument breakdowns.
DXY (U.S. Dollar Index)
Over the past few weeks, the dollar‑index completed a breakout of the rising trend‑line after showing divergence on the weekly chart, signalling that sellers have entered the market. On the weekly time‑frame the MACD turned positive (which means the worst of the drop may be behind) but with no bullish divergence forming, the trend is not reversed yet. In his view this means: expect a corrective bounce, not a full reversal.
On the daily frame the formation of a double‑bottom plus bullish divergence indicates buyers are starting to test control. The trend‑line breakout adds weight to this. Nikkhil thus anticipates a short‑term bounce toward the fib retracement levels (23 % at 99.82, 38.2 % at 101.68, 50 % at 103.19) - but emphasises that the prevailing medium‑term trend remains lower until proven otherwise.

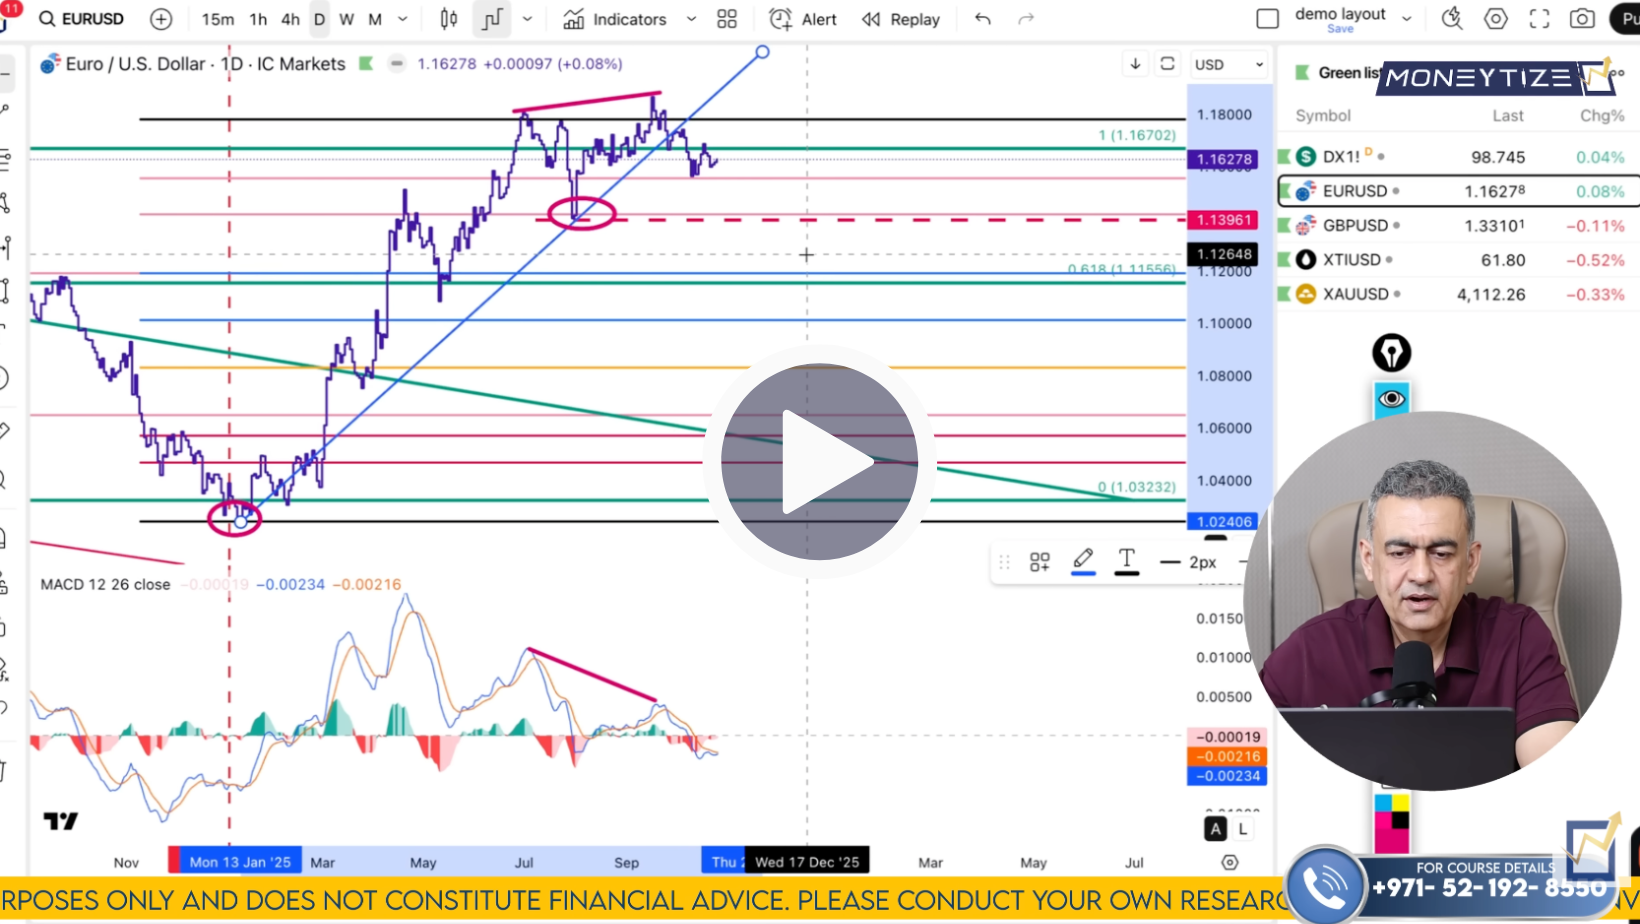
EUR/USD
Because the dollar is showing signs of short‑term weakness, EUR/USD is positioned to benefit - especially ahead of the ECB rate decision. On the monthly chart, a lower‑low formation with bullish divergence suggests sellers may be exhausted and buyers are gearing up. A bullish trend‑line breakout supports this. But on the weekly and daily frames, momentum indicators show fatigue - so Nikkhil expects a short‑term bounce first, before resumption of the broader downward bias.
He sees EUR/USD moving up in the near term to 1.1670‑1.1680 (with a possible stretch to 1.1742) ahead of resistance; and only then does he expect the bias to shift and the pair to head lower to 1.1550 and ultimately 1.1430.
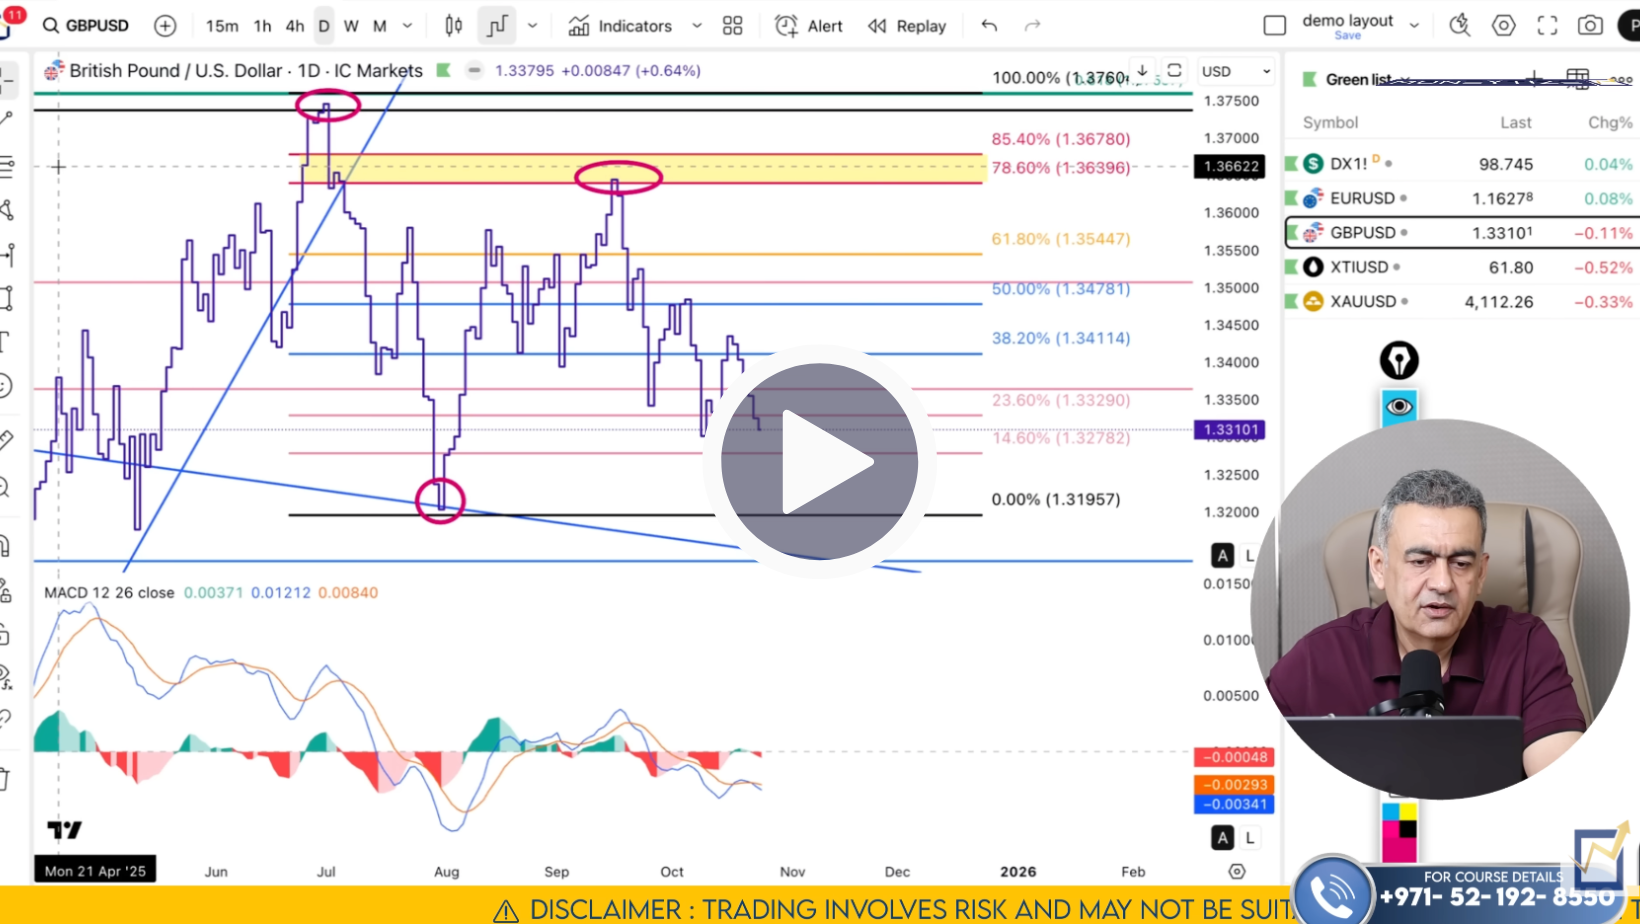
GBP/USD
On GBP/USD the pattern is very similar to EUR/USD but perhaps even more stressed by dollar strength. Monthly charts show bullish divergence, but the leg up reached the 100 % fib extension (1.3759) and then sellers gained control. The weekly chart shows higher‑highs but with weakening momentum - signalling exhaustion. On the daily and 4‑hourly frames, bearish divergence is already in place, breakout of the rising trend‑line happened, and buyers on the short‑term 4‑hour chart are showing signs of fatigue (despite a brief counter‑move up to 1.3415‑1.3488). Nikkhil’s plan: look for a short‑term bounce (if one occurs) but then a move lower toward 1.3100.
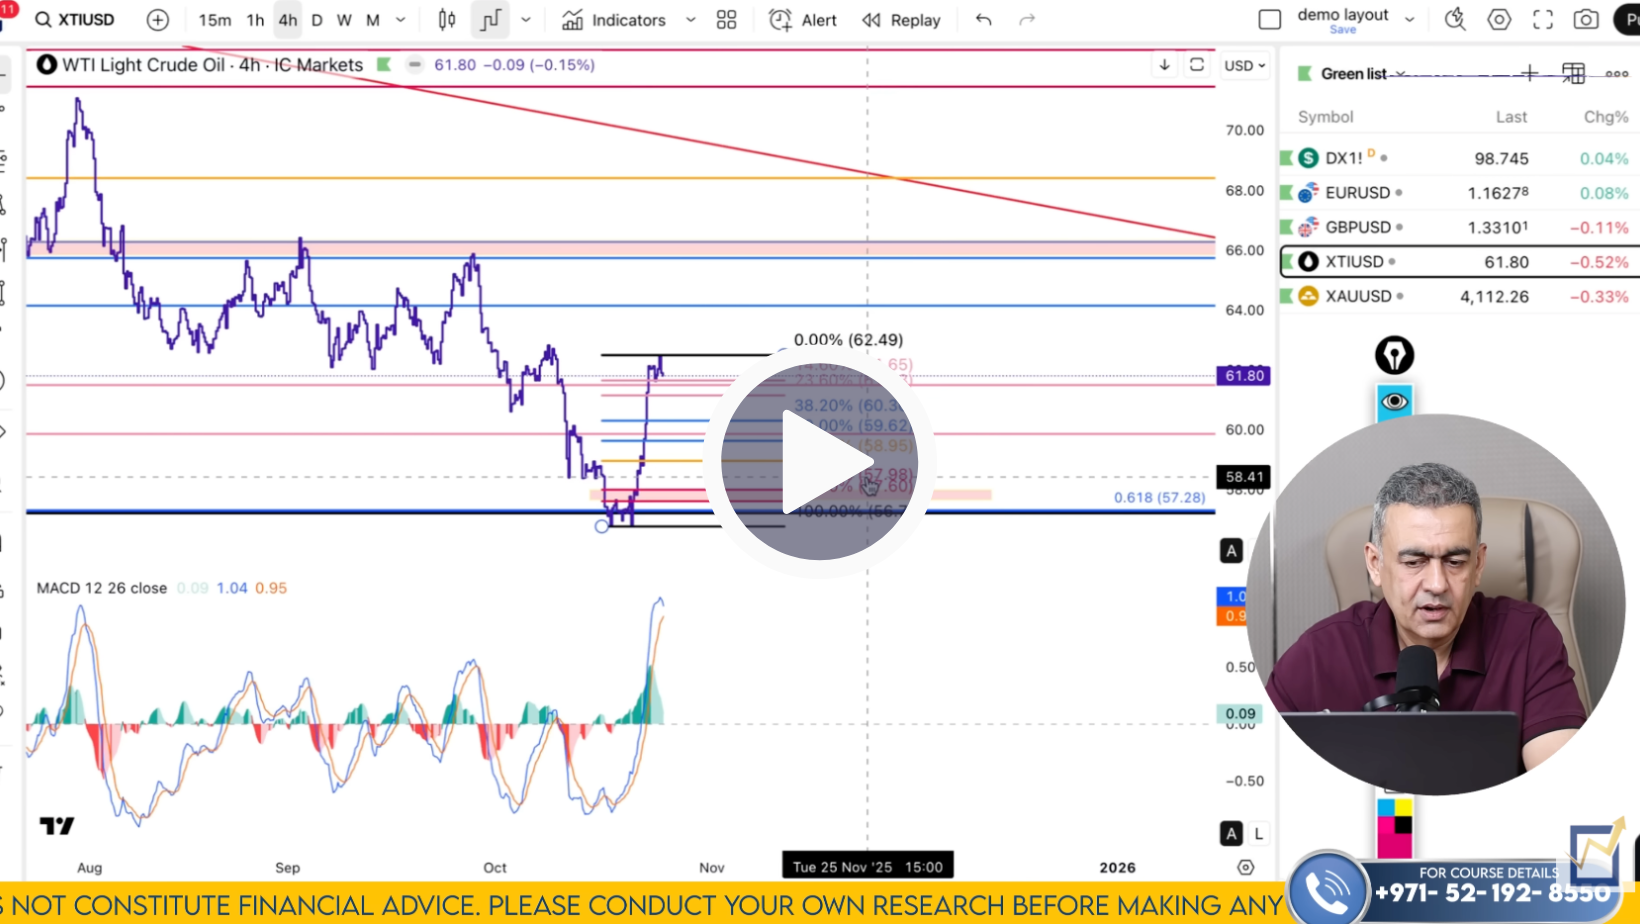
Crude Oil
Moving to commodities, crude oil has been under pressure. On the monthly chart a move down from the highs shows that the 23.6 % fib retracement is acting as resistance. On the weekly chart there's a double‑bottom forming around 57.28 with early signs of bullish divergence. At the daily frame, buyers haven’t yet taken over control; on the 4‑hour frame Nikkhil spots the pullback zones (59.62 to 57.6) as potential buy levels for a short‑term bounce up toward 63.33 and possibly 65‑66. If the price breaks below 57.60‑57.98, the bullish plan would be invalidated.
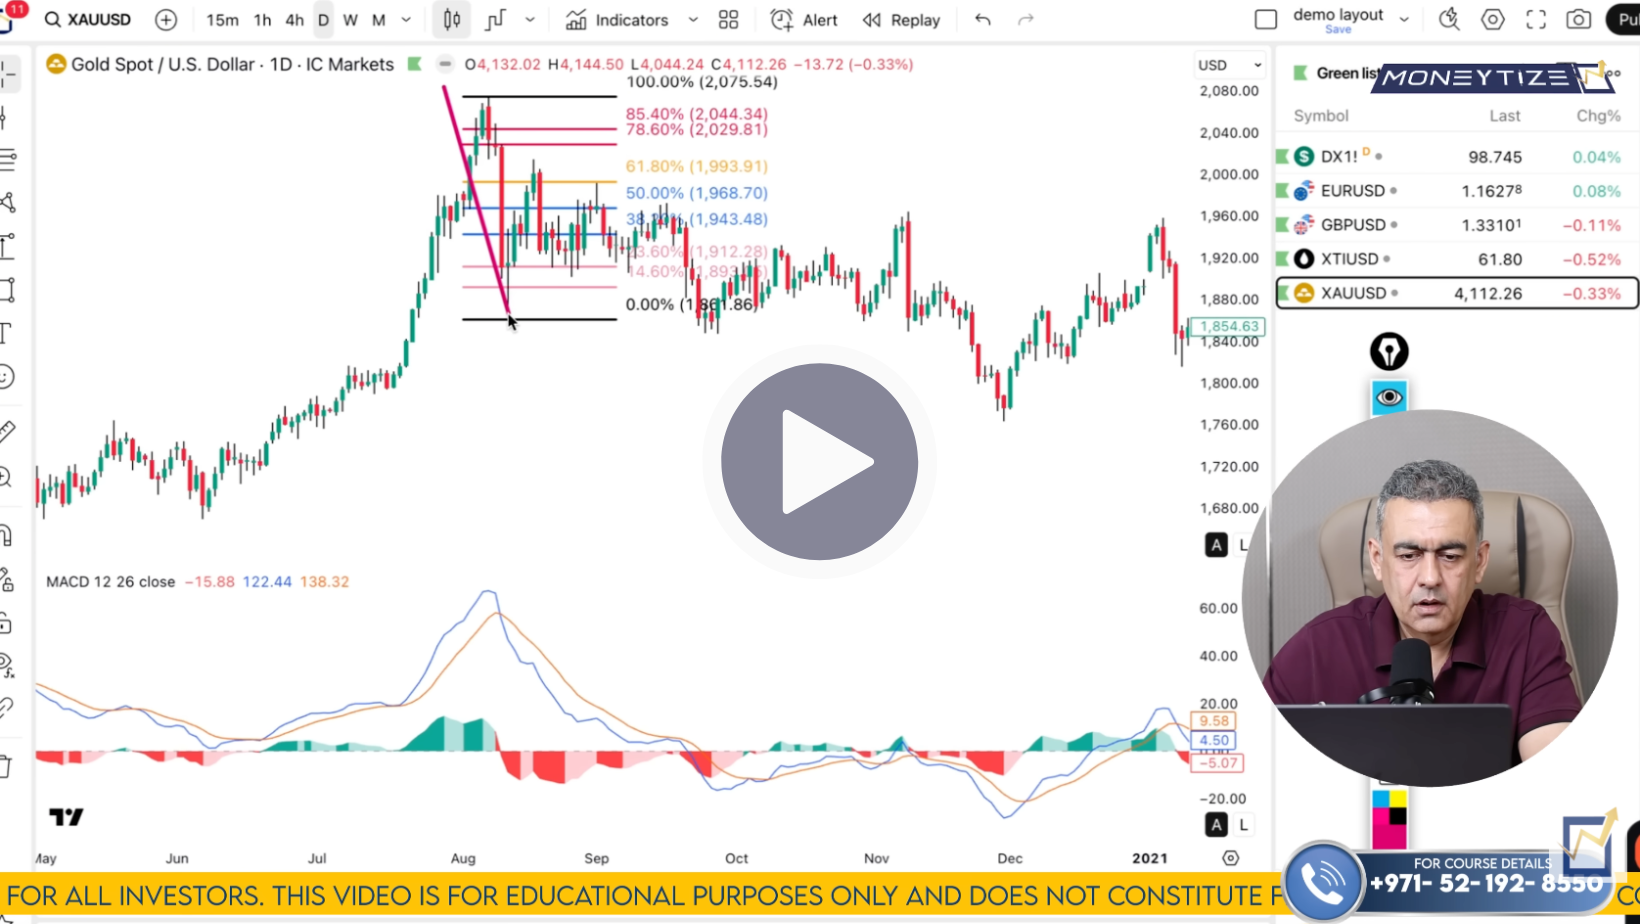
Gold (XAU/USD)
Here’s the one that caught many traders off-guard: gold suffered its largest single-day drop since 2020. Many retail traders were unprepared. But as Nikkhil emphasised last week, if you plot the support levels and liquidity zones, the move was anticipated. The price cleared the liquidity below the prior structure, bounced, and is now in a retracement phase.
On the weekly chart, gold shows a strong parabolic run (higher-highs on price and MACD aligned), which argues against a trend reversal - the drop appears to be a healthy pullback. On the daily chart, the drop resembles the 2020 pullback pattern, where gold retraced around 61 % before resuming its uptrend.
Nikkhil’s short-term view: a bounce toward 4,213 or 4,250 (best-case 4,300) is likely - unless gold breaks below 4,092 or 4,058. In that case, deeper targets at 3,950 and an extended move toward 3,815–3,750 come into play.
In summary: you’re looking at a week where the major central‑banks make key decisions, and which could spark sharp moves in dollar, euro, pound, oil and gold. Nikkhil’s levels are live - preparation, patience and disciplined execution are going to matter.
Click here to watch the full Moneytize Forecast
We’ll talk soon
Team Moneytize