

Welcome back to our new weekly forecast for the trading week starting November 24th. We’re entering a high‑volatility week as the DXY (U.S. Dollar Index) is at a critical juncture, major currency pairs are showing signs of structural shifts, and the market is responding to both mixed U.S. economic data and active gold‑buying by central banks. Nikkhil has mapped out how each instrument is behaving, where he sees opportunity, and what levels you should have on your radar so you’re prepared and not surprised.
DXY (U.S. Dollar Index)
The DXY recently dropped to the 138.2% extension of its last leg up, then bounced. On the daily chart, Nikkhil identifies the 78.6%‑to‑85.4% retracement zone of the previous leg as the major resistance area (roughly 101.70 to 102.33). Locally, the 100% extension (just above 100.39) is acting as resistance right now.
Drilling down to the 4‑hour chart, we see a bearish divergence between the previous highs - showing buyer weakness - but sellers haven’t yet broken the structure. With the trend‑line break and retest still valid, a double‑top formation may develop, and if DXY falls below the rising trend‑line and retraces to 100.04 (61.8% of the leg), a deeper correction may follow.
On the 1‑hour chart, a shallow rising trend‑line supports the recent double‑bottom, so a break below here could trigger a short‑term pullback before the continuation upward. On the 15‑minute frame, a retracement from 100.33‑100.31 acts as potential resistance, and support is clustered between 100.14‑100.04.
Nikkhil’s take: Short‑term bias is modestly bullish toward 101.70‑102.33, but only if price clears the 100% extension cleanly. A failure there and break below trend‑lines could open a corrective drop.

EUR/USD
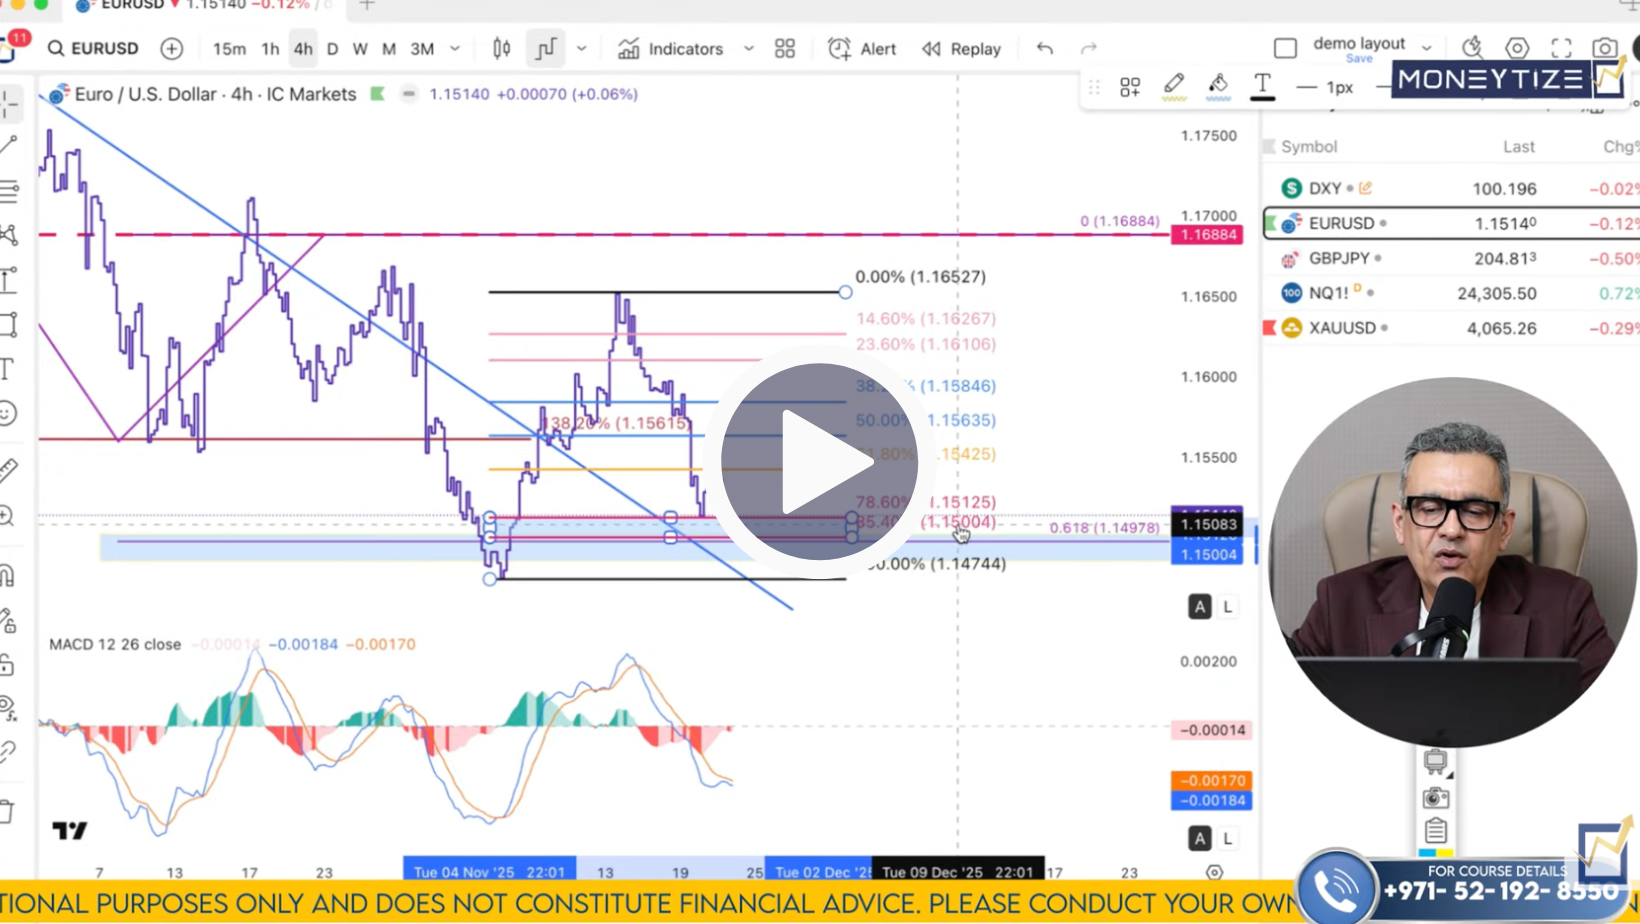
For the euro versus the dollar, Nikkhil applied a reverse Fibonacci on the prior down‑leg and mapped extension levels. The pair rose to the 161.8% extension, completed a bearish divergence, and started rolling down. The first fib extension (A‑B‑C) shows local support at 1.1497. A bullish divergence is forming between two lows, indicating sellers may be exhausted (though MACD lines still show lower lows, so caution).
From the 4‑hour chart, the pair has retraced to the 78.6%‑85.4% zone of the recent up‑leg and found support around 1.1500. Short‑term bounce toward 1.1610 (best case 1.1626) is possible. On the 1‑hour timeframe, a break above 1.1540/1.1541 or a trend‑line break could signal a short‑term buy opportunity, with target 1.1620. In the longer term, if the bounce fails, the bearish view resumes and further decline to 1.1392 is possible.
Nikkhil’s take: Short‑term bounce toward 1.1610 is the most probable. But unless we see convincing structure breaks, the medium‑term path remains lower.
GBP/JPY
The British Pound/Japanese Yen pair is showing strong bullish structure. On the monthly frame, Nikkhil applied a Fibonacci retracement from the 2007 high (247.71) downward. He identifies the long‑term resistance zone around 220‑228, and long‑term support around 137‑149. On the bullish extension from the lowest point (A‑B‑C) he has magnet zones and strong support around 183.26.
On the weekly chart the extension and retracement place the current support zone at 201.53‑202.97, and momentum is rising. On the daily chart, the pair made a new high but faces resistance at 206.07; a break of that would clear the next magnet zone to 211. On the 4‑hour chart the pattern is bullish: the pair is sitting at a fib retracement 23.6% from the last leg up, and support zones at 203.71 and 202.88. On the 1‑hour chart we see higher highs/higher lows building, so every drop is an opportunity to buy. Only a close below the 85.4% support (200.38) invalidates the bullish scenario.
Nikkhil’s take: He remains bullish. His plan is to accumulate on dips and the next target is 211. Stop‑out level is a clear structure break below 200.38.

NASDAQ (Tech Index)
For the NAS100/NASDAQ index, the monthly frame shows a strong up‑trend with higher highs/lows and a bounce from the 161% fib extension support. On the weekly frame, the pair has cleared the 161.8% resistance (25,215) and finds support at 24,287. Currently the index is in between support and resistance zones and showing early signs of short‑term weakness (MACD histogram dropping). On the daily chart we see bearish divergence across higher highs; the 4‑hour chart shows a last leg down and price sitting near fib retracement 138.2% (support 24,245‑24,350). Short‑term trade plan: buy‑and‑hold toward 25,000 if price holds above support (24,245) and if price fails to break 25,104/25,245 then expect a bounce back toward support. A daily close below 24,245 with a retest as resistance will invalidate the bullish bias and open deeper correction.
Nikkhil’s take: Short‑term buy bias, target 25,000. But only if the structure holds. Failure to break key resistance would flip the script.

Gold (XAU/USD)
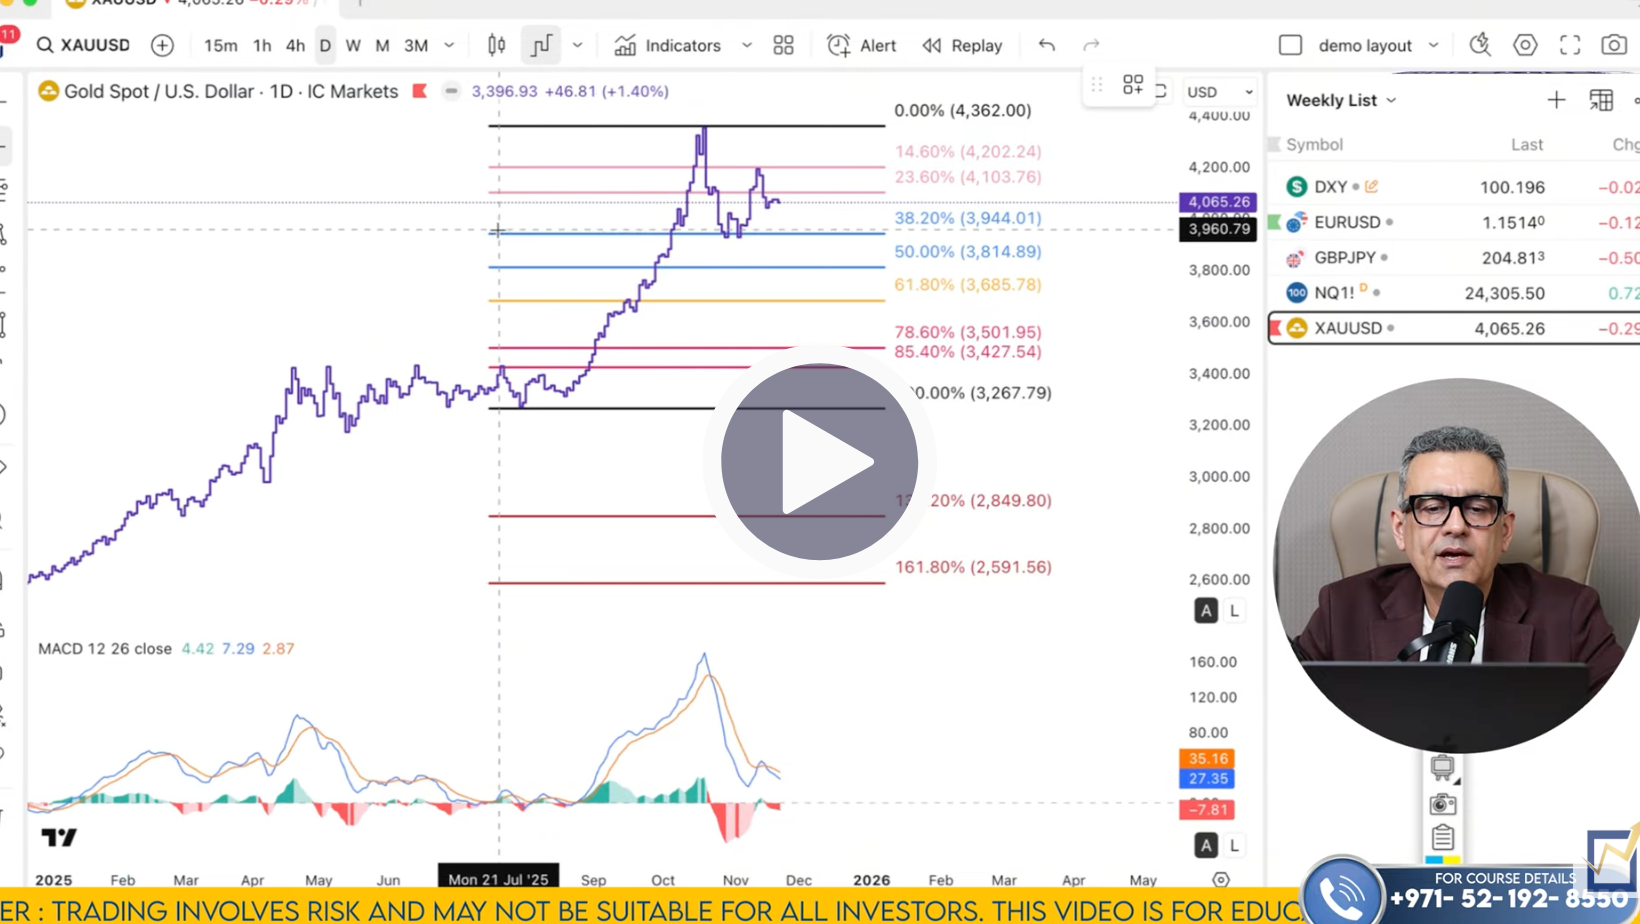
Finally, for Gold, after the parabolic run up, price is in a compression phase. On the daily chart, the 38% retracement from the last leg up hits support around 3,944; resistance is 4,202. On the 4‑hour chart we see a triangle formation - higher lows and lower highs - a classic consolidation structure after a strong move. Fib retracement places resistance in the 78.6%‑85.4% zone and support in the 14.6‑23.6% zone. Unless gold falls below 3,970 (with retest 4,011‑4,001 acting as resistance), the bullish view remains intact.
Trade plan: break of the triangle and valid retest then target 4,170‑4,190, next 4,269‑4,300. A break below 3,970 would invalidate the bullish scenario and shift bias.
Nikkhil’s take: He is not looking to short gold. He’s looking for buys only here. First target 4,135, next 4,180‑4,190, then 4,269‑4,300.
In summary: We have a USD index at a reaction zone, EUR/USD showing potential short‑term bounce but medium‑term risk, GBP/JPY bullish, NASDAQ at a critical inflection, and gold in a breakout‑ready consolidation.
Fundamental themes (strong dollar, central‑bank gold buying) combined with these technical setups create actionable conditions.
The levels are live.
The moves are coming.
Watch the full breakdown now and get your game‑plan in place before the herd reacts.
Click here to watch the full Moneytize Forecast
We’ll talk soon
Team Moneytize