

Welcome to this week’s forecast from Moneytize. This week promises to bring meaningful setups across major forex instruments. With key price‑zones now aligning and market structure flashing signs of continuation or reversal, Nikkhil has mapped the maps so you can trade prepared, not reactive.
DXY (U.S. Dollar Index)
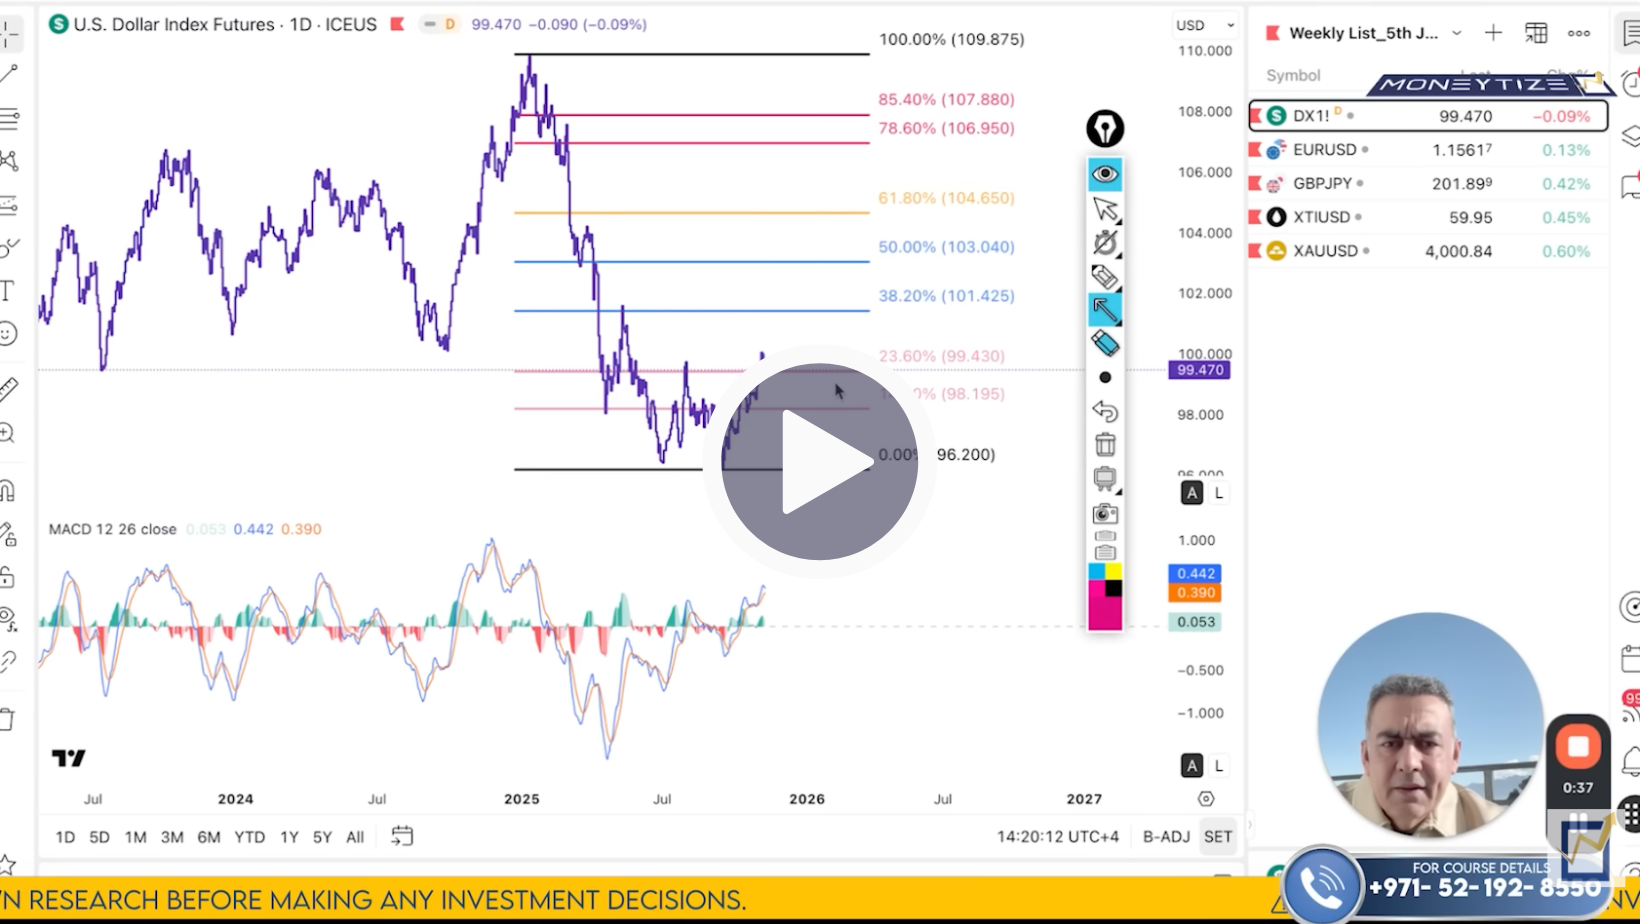
On the daily frame, Nikkhil identifies a retracement from the prior swing high down to the current low. The index has already crossed just above the 23.6 % level. He highlights that the 14.6 % retracement area around 98.19 is acting as a flow‑zone and expects a short‑term pullback before a continuation higher toward the 38.2 % retracement near 101.42.
Dropping into the 4‑hour chart, the structure shows higher highs and higher lows, which supports the bullish case. Even though there’s divergence between the last two highs that suggests some momentum fatigue, Nikkhil does not expect the structure to break just yet. He uses a rising trend line from the last leg (connect‑point C) as support; a valid break and retest would alter the setup. On the hourly frame, bearish divergence again points to a possible pullback leg in the short term - Nikkhil sees one more leg down (or a false breakout) before the bullish trend resumes.
In short: pullback in DXY is still part of the bullish trend. He’s watching for price to hold above 98.62 and then resume toward the 100.10 breakout region and beyond.
EUR/USD
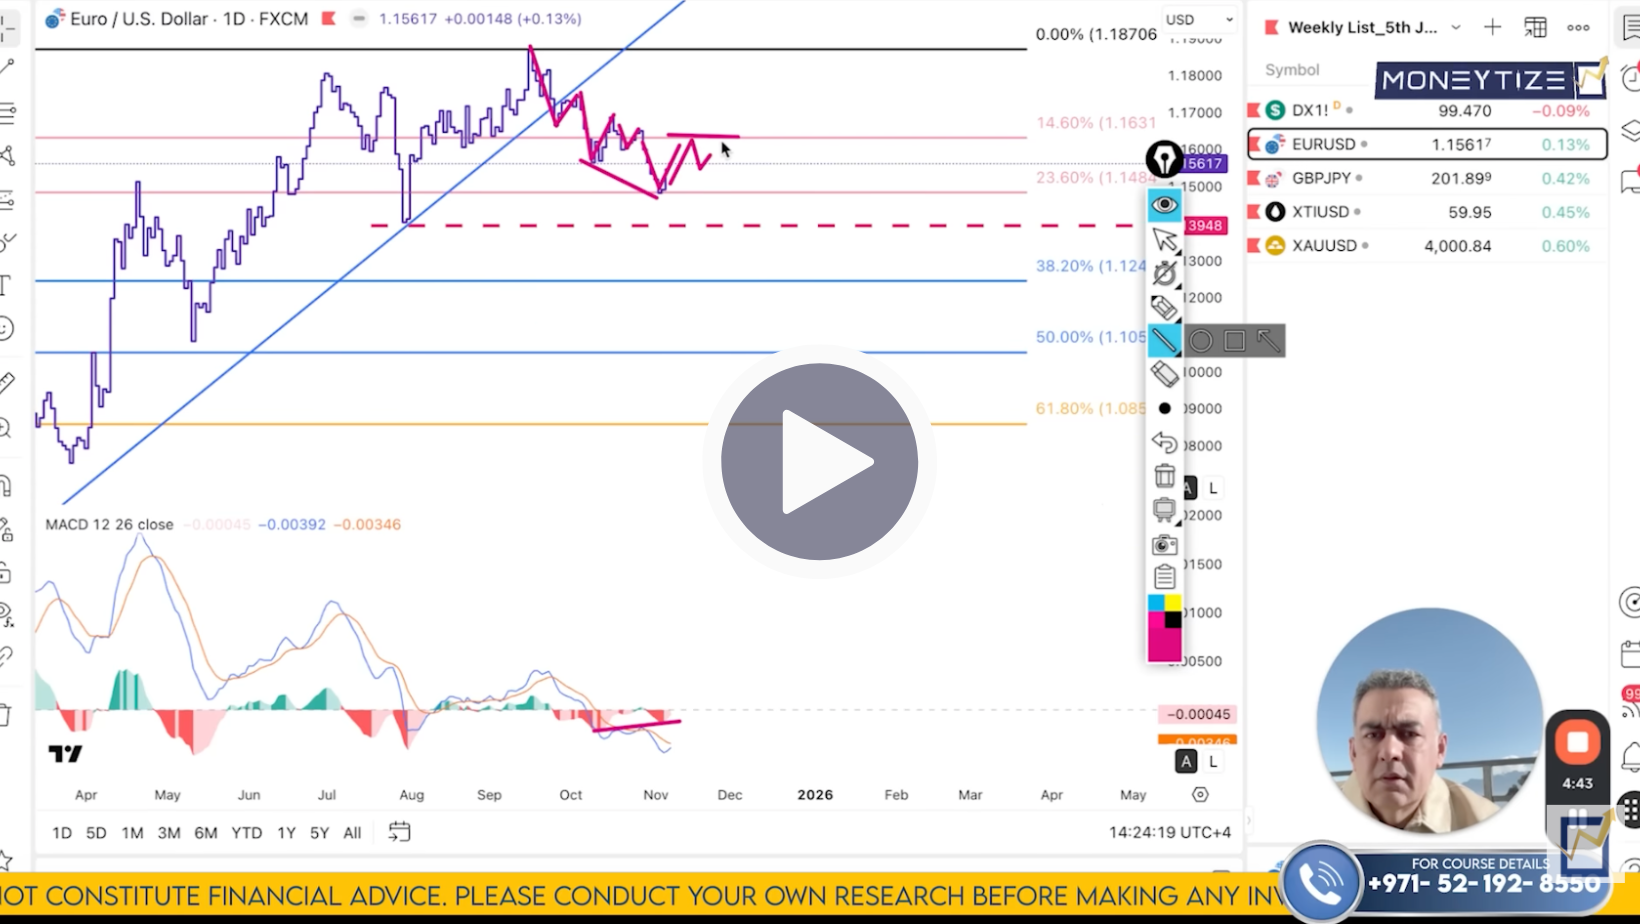
Here on the daily frame, Nikkhil has drawn a retracement from the recent low to the high. The pair formed a higher high accompanied by bearish divergence, and the rising trend line has been compromised - a sign that sellers are stepping in. On the 4‑hour chart, there’s a clear broken falling trend line; if we see a convincing breakout above it with a valid retest, that would invalidate the bearish plan. But for now the primary view is bearish: any bounce toward 1.1631 (the 14.6 % retracement) is an opportunity to sell, with targets as low as 1.1484 then 1.1397 and ultimately 1.1245.
In other words: EUR/USD is under pressure. Unless price breaks above 1.1710 (and the falling trend line), the bias remains lower.
GBP/JPY
On a higher‑timeframe (monthly) basis, Nikkhil spots a long‑term bullish trend. He marks a swing low point C as the anchor of the last leg up; the current “magnet zone” is around 199.99 (rounded to 200) and the next major target is 210 (and then 215). On the weekly chart, the next key floor is 182 and 199 respectively. On the daily chart the recent floor is 196‑198.59 and resistance just above 202.35‑202.45. On the 4‑hour chart the price structure shows that the latest breakout leg is still intact. A 4‑hour close below 198.77 would invalidate the bullish view, but as long as price holds above that zone, the setup remains valid. So the bullish bias stands: a sustained move above 203.19 opens 204.87 and ultimately 206.40.
In short: GBP/JPY remains bullish. Unless price slips under 198.77 on 4‑hour close, expect upside toward 210+.

Crude Oil (WTI)
Beginning on the daily chart, Nikkhil identifies that crude oil is stuck between the 50 % and 61.8 % retracement of the preceding up‑move. A falling trend line looms (66.18) and the formation of a double‑bottom suggests a short‑term bullish bounce toward that trend line/resistance area, then possibly continuation lower. He plots the next major resistance at 66.18, then 68.63‑63 should there be a breakout. On the 4‑hour chart the sell‑side momentum appears to have weakened: lower lows, divergence and the buyers stepping in. The key floor in his view is $57.99 ($58). As long as price holds above ~$58, the first leg higher is open to $61.10 (23.6 % retracement), $61.62‑62 and eventually $62.45. On the hourly and 15‑minute charts the short term remains under the influence of a falling trend line - a breakout above that is required to truly validate the bullish bounce. Otherwise, a closure below $58 invalidates the bullish short‑term view.
So: The plan is to buy dips above $58, targeting $61‑62+; but remain ready to flip if $58 breaks.

Gold (XAU/USD)
On the daily chart, gold has pulled back to the 38.2 % Fibonacci retracement of its previous bullish leg, with $3,930 acting as a strong support base. The current resistance band sits between $3,997 and $4, 009, where price has been coiling in a tight range. Nikkhil notes that this sideways action is accompanied by bullish divergence on lower timeframes, a signal that seller momentum is fading.
A confirmed break above $4,009 would open the door to the next extension targets: $4,027 and $4,040 initially, followed by a key resistance at $4,080. If momentum sustains beyond that, price could extend to $4,118 and potentially $4,165‑4,170. On the downside, the bullish plan remains valid as long as price holds above $3,930. A breakdown below that could signal a deeper correction toward $3,800.
So in short: gold is poised at a pivotal resistance. A clean breakout above $4 009 could unlock a sharper move toward higher targets.

It’s a week where structure matters: holding trend‑lines, validating breakouts and managing risk will differentiate smart trades from reactive ones. Across DXY, EUR/USD, GBP/JPY, crude oil and gold the setups are live. You’ve got levels. You’ve got scenarios. Now it’s execution time with patience and precision.
Click here to watch the full Moneytize Forecast
We’ll talk soon
Team Moneytize