
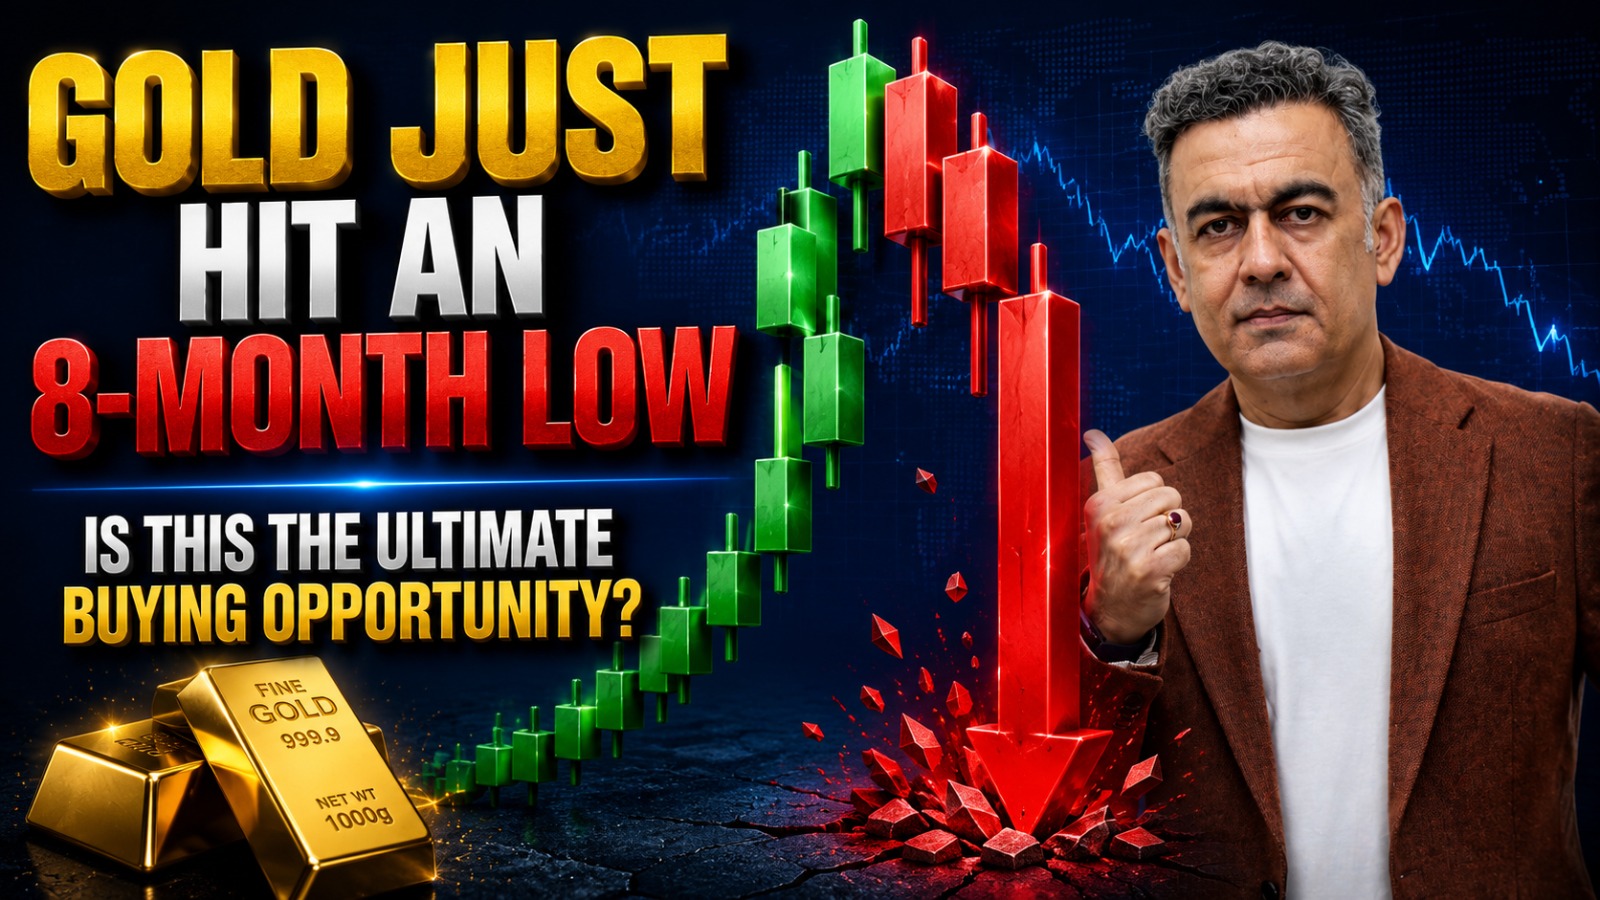
Gold Retested Its 8-Month Low and Refused to Break. Now It Has to Prove It.
Gold spent the week staring down the lowest prices it has seen in eight months — and, for now, refused to fall through them.
The floor at 3,941, first carved on 30 June, pulled price back for a retest on Friday, and the move had every hallmark of a breakdown. It cut through 3,972 — the shelf where a wall of stop orders was resting — triggered them, and slid to 3,955. Then, a handful of dollars above the June low, it simply stopped. It never printed a new low. What followed was a clean reversal that erased the entire drop and closed the week green at 4,017.
That sequence is the market's oldest riddle. A retest that holds is the raw material of a bottom; a retest that fails is the opening move of a crash. Friday gave us the first half of the story — the resolution comes down to two lines: a floor that has to hold, and a ceiling that has to give way. Both sit just below current price, and the supporting evidence is spread across the dollar, crude and silver.


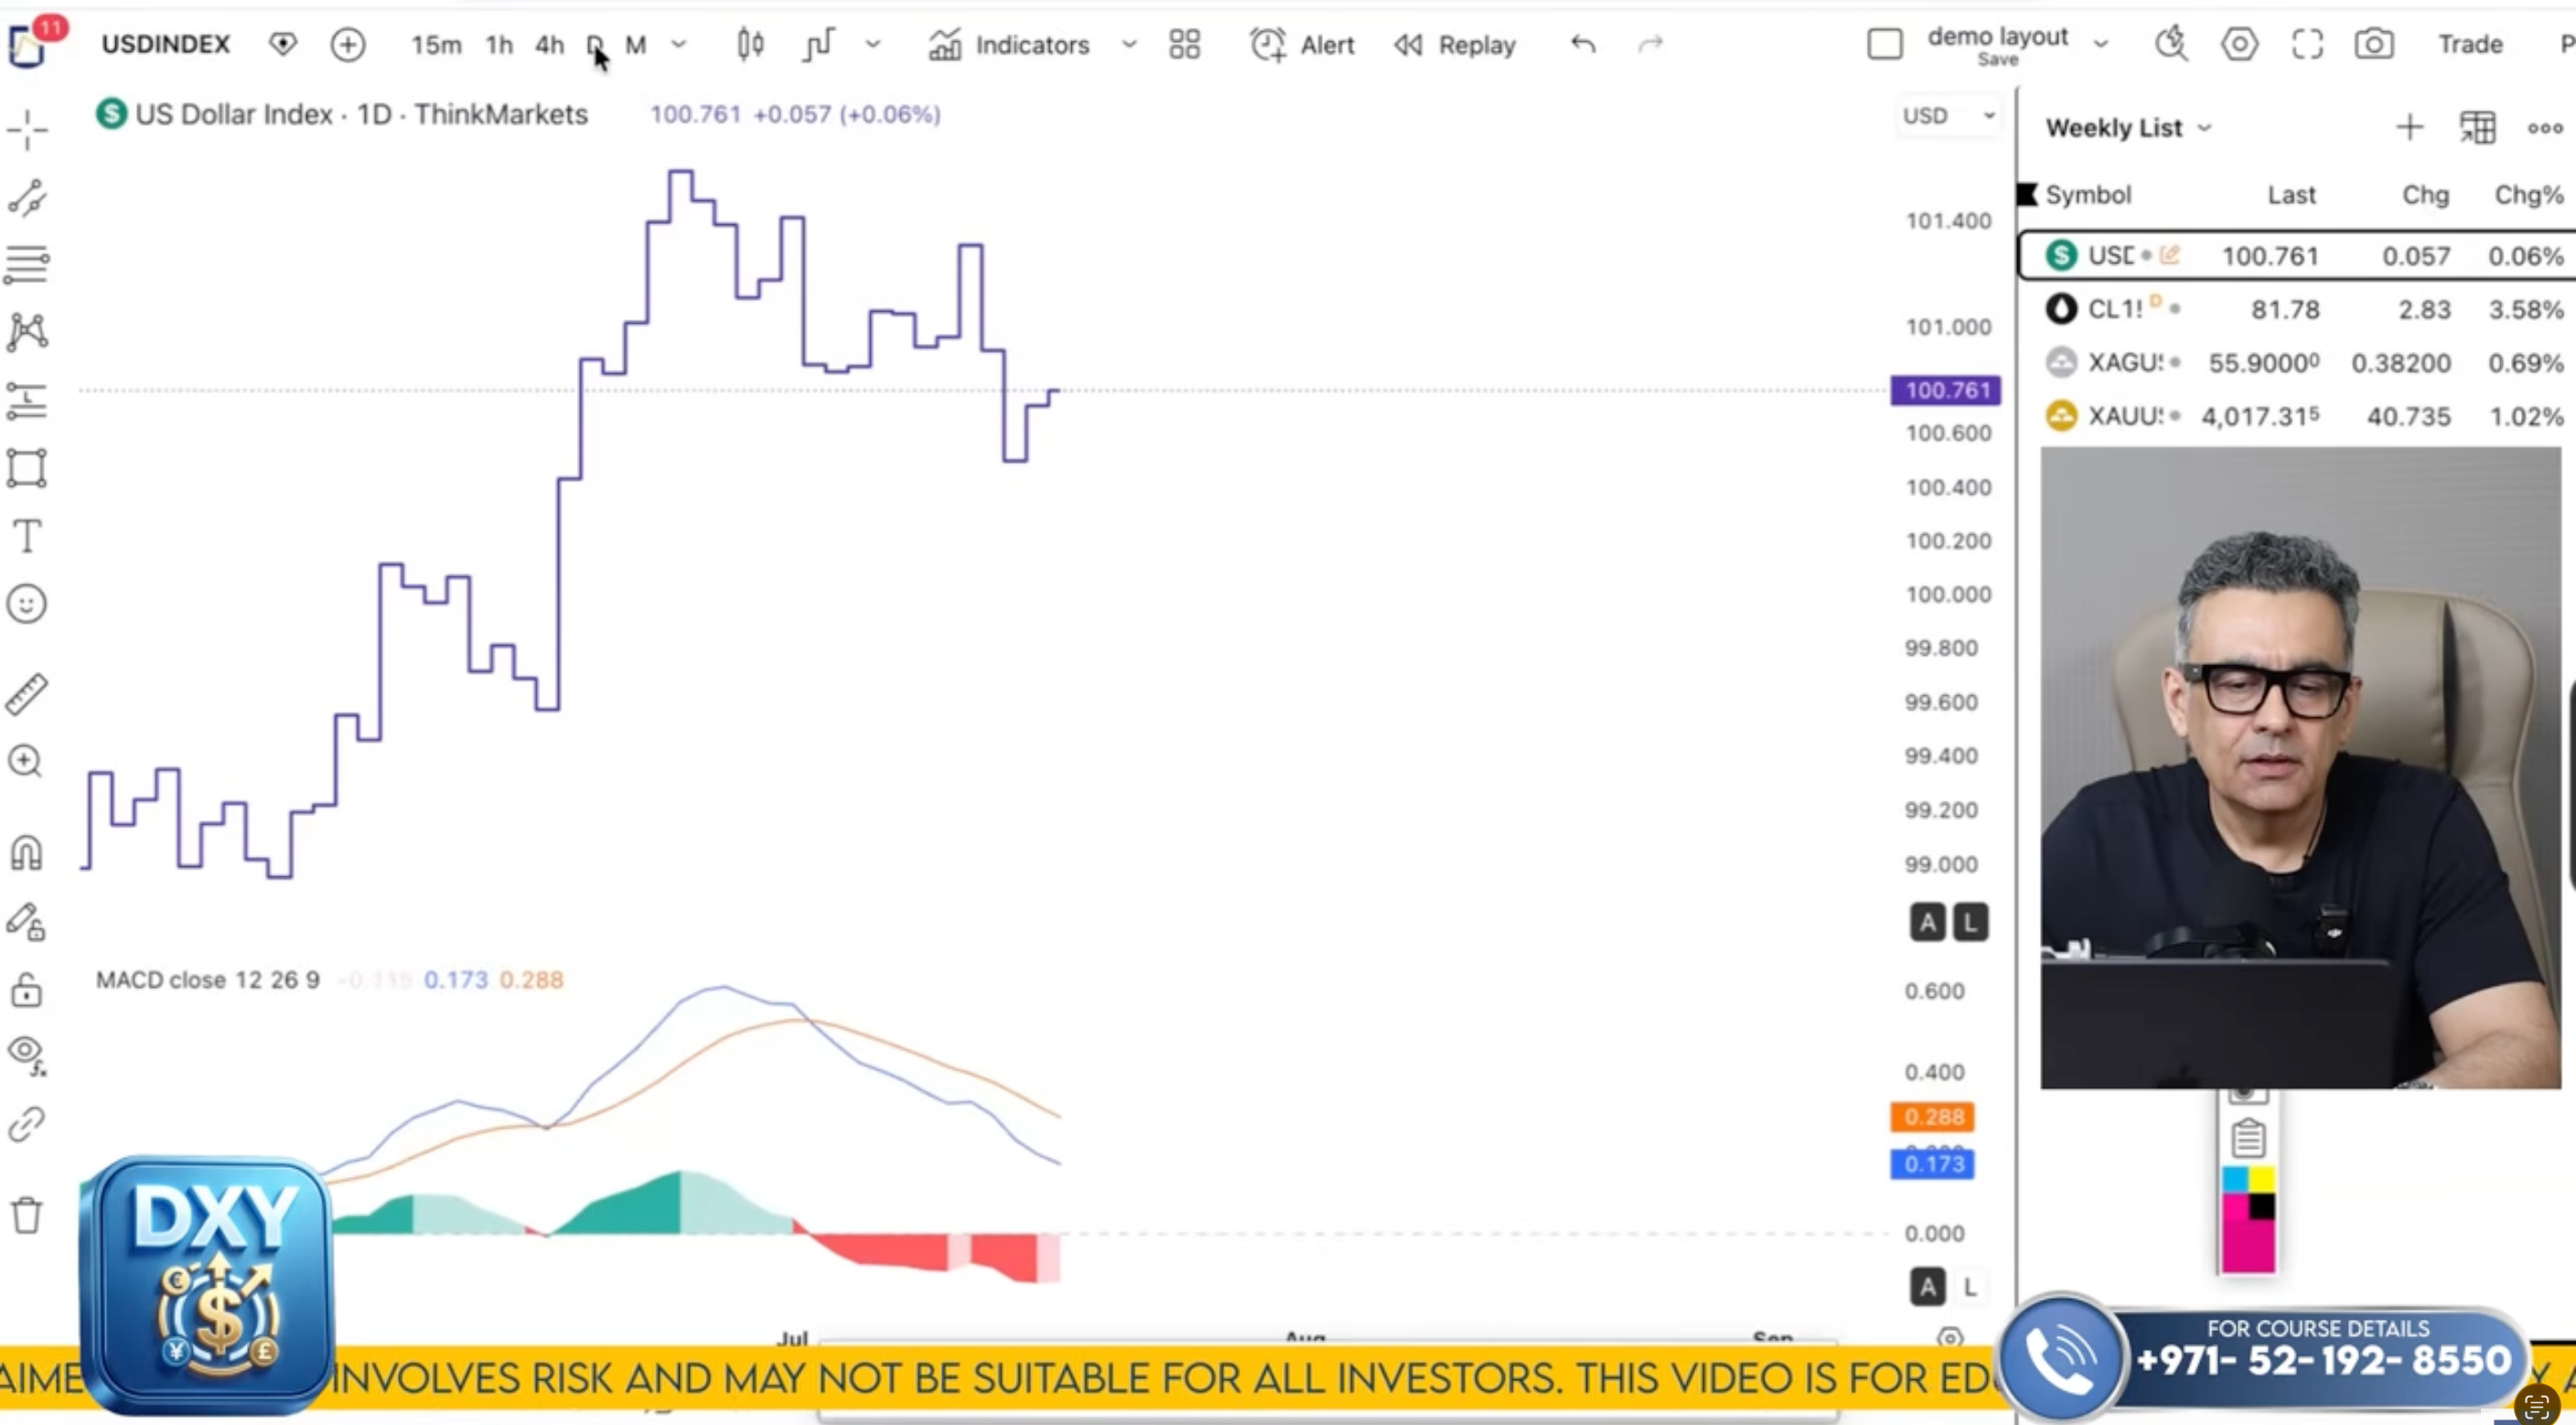
DXY - Dollar Index
The dollar's larger trend still points up — a steady ladder of higher highs and higher lows on the four-hour. What's happening now is a breather, not a break: price has eased back into support after stalling beneath the 100.96 ceiling.
To restart the climb, buyers need to reclaim 100.96, and on the hourly the more immediate conditions are holding 100.40 and clearing the falling trend line overhead. Push above 100.96–101.00, hold it as new support, and the road opens toward 101.67–101.87. The read is simple: a corrective dip today, bullish continuation in the days ahead — and a firmer dollar is a weight on gold, which is exactly why it's the first chart to check.
CRUDEOIL
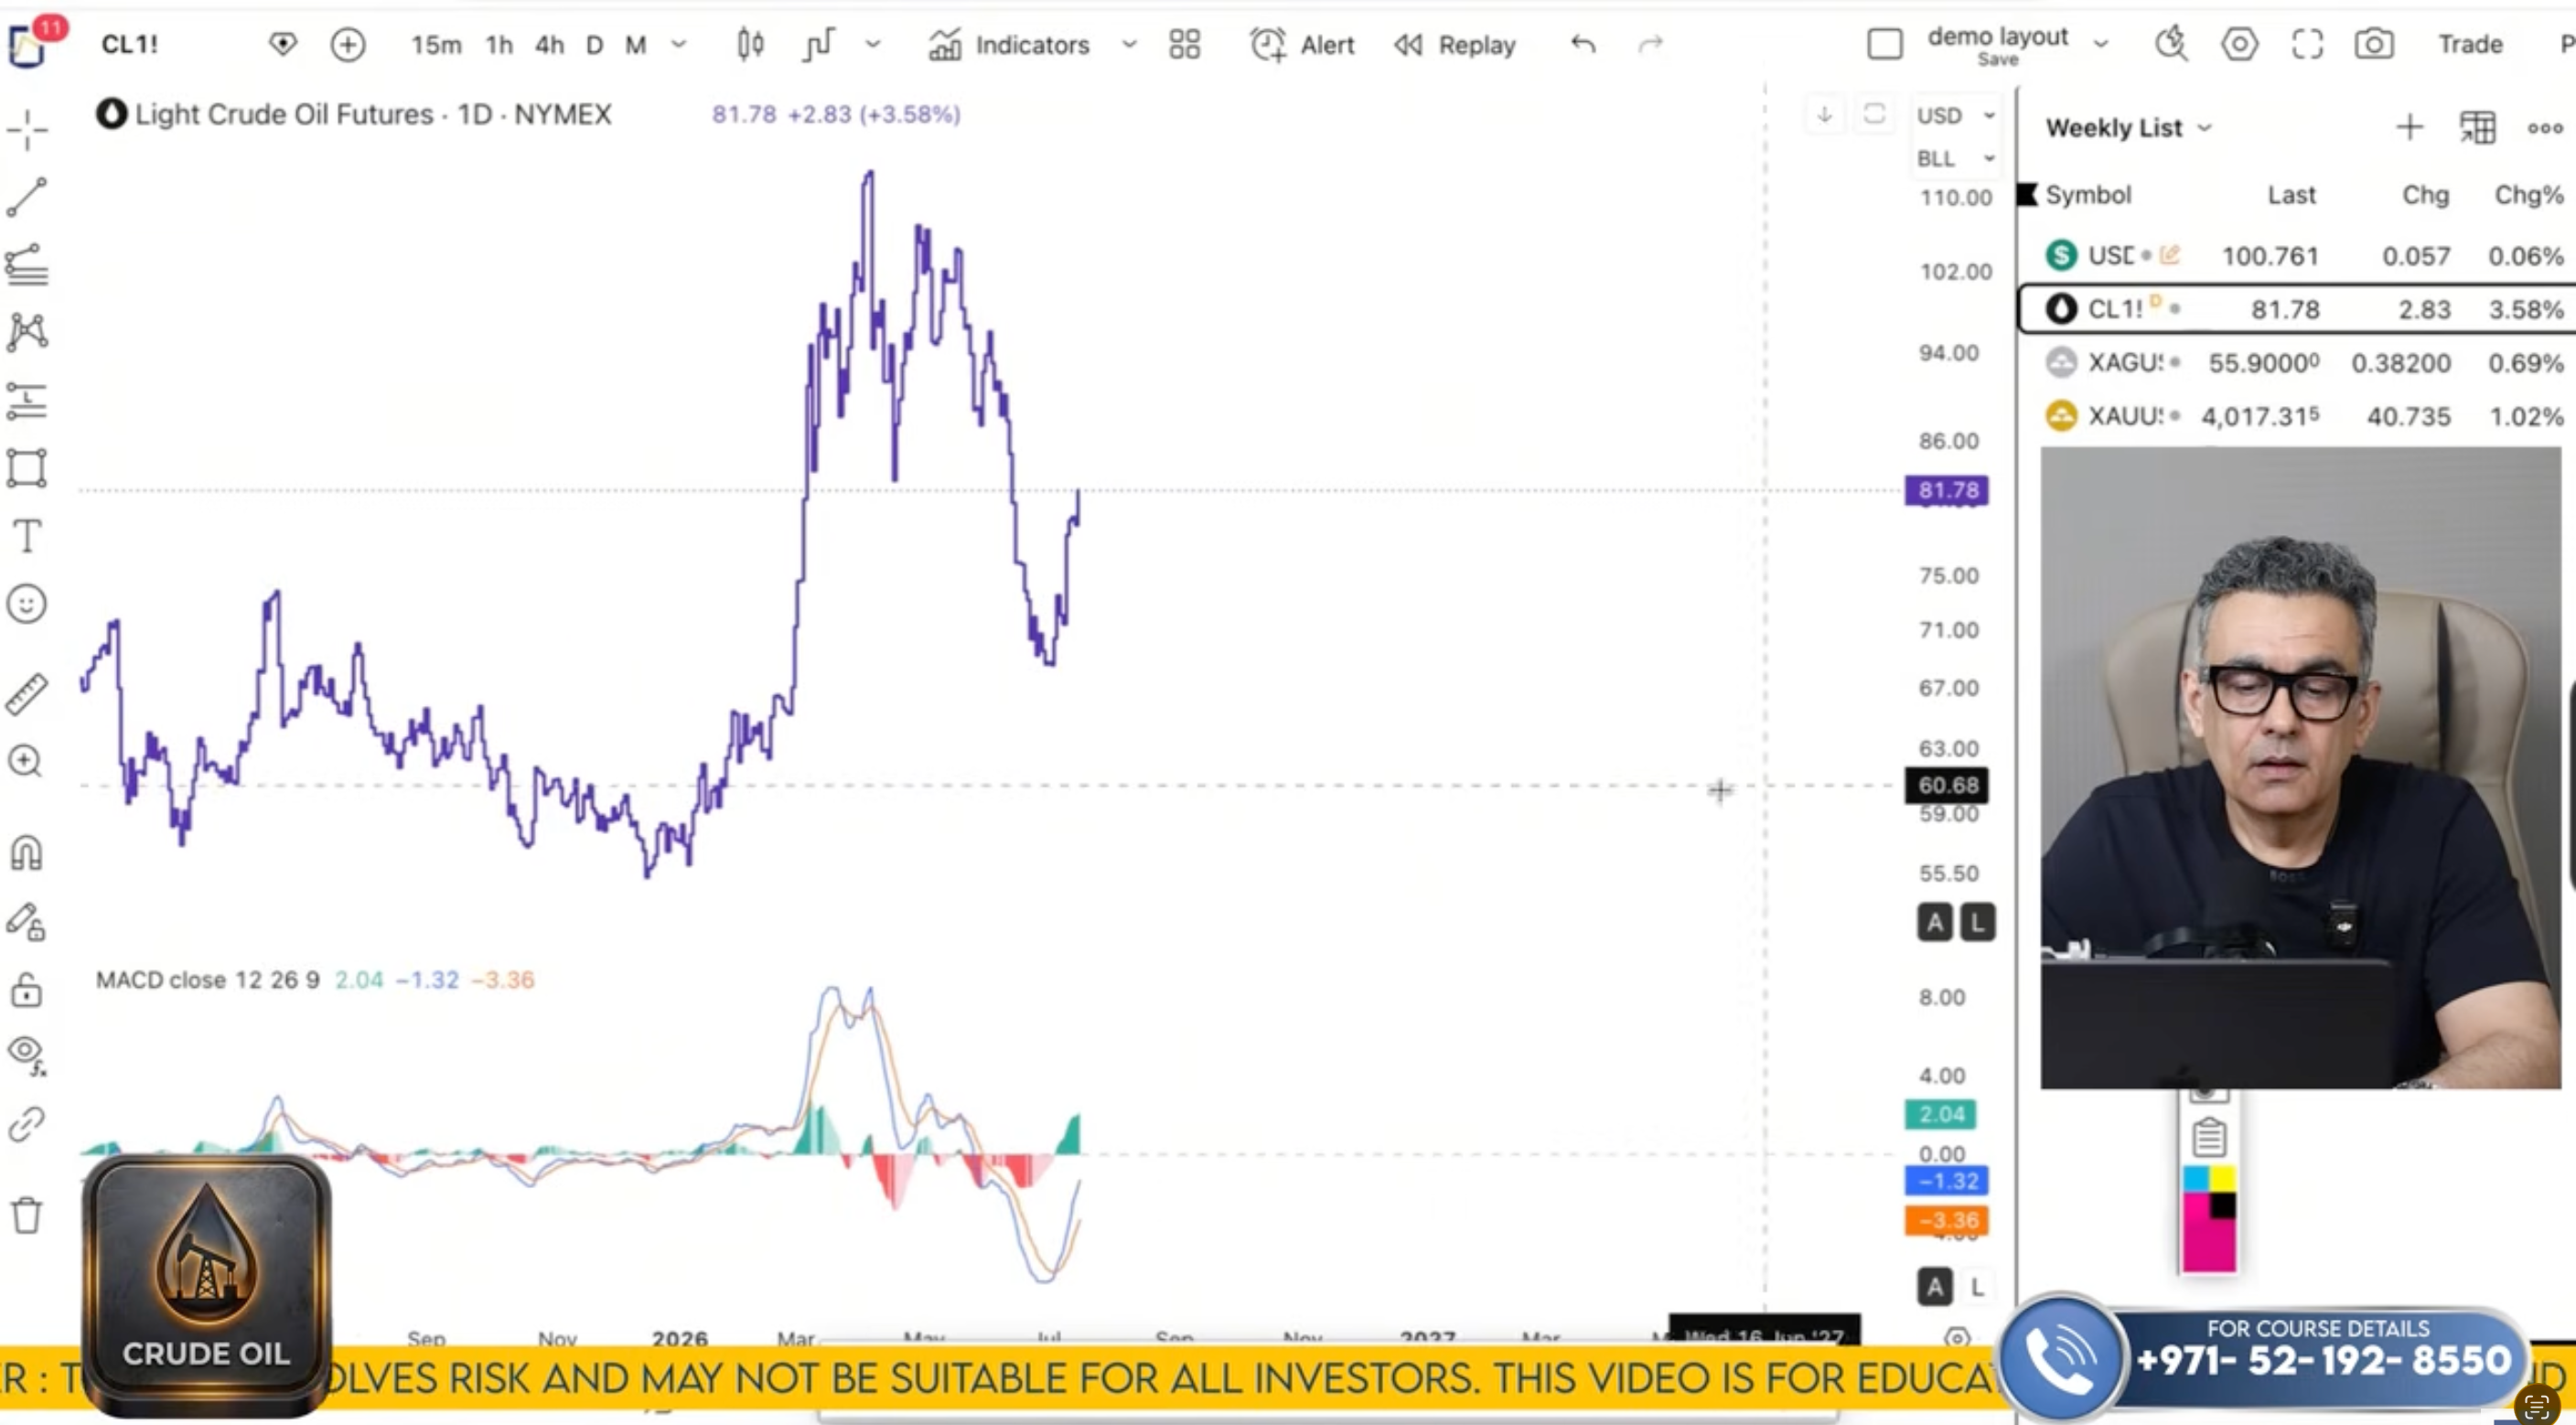
Crude's dominant structure is still bearish, but what's unfolding right now is a corrective bounce. On the four-hour, price is stacking higher highs and higher lows inside a recovery, and Nikkhil's plan leans on patience: he wants a pullback into the 74.73–76.48 support band before the move stretches up toward 85.99–88.25, where he'd expect the larger downtrend to reassert itself.
Put plainly: buy the dip, aim for 86.00–88.25, and keep the idea alive only while 74.73–76.48 holds. The 15-minute is already grinding higher, so a soft open on Monday is the kind of dip he'd treat as an entry rather than a warning.
XAGUSD (SILVER)
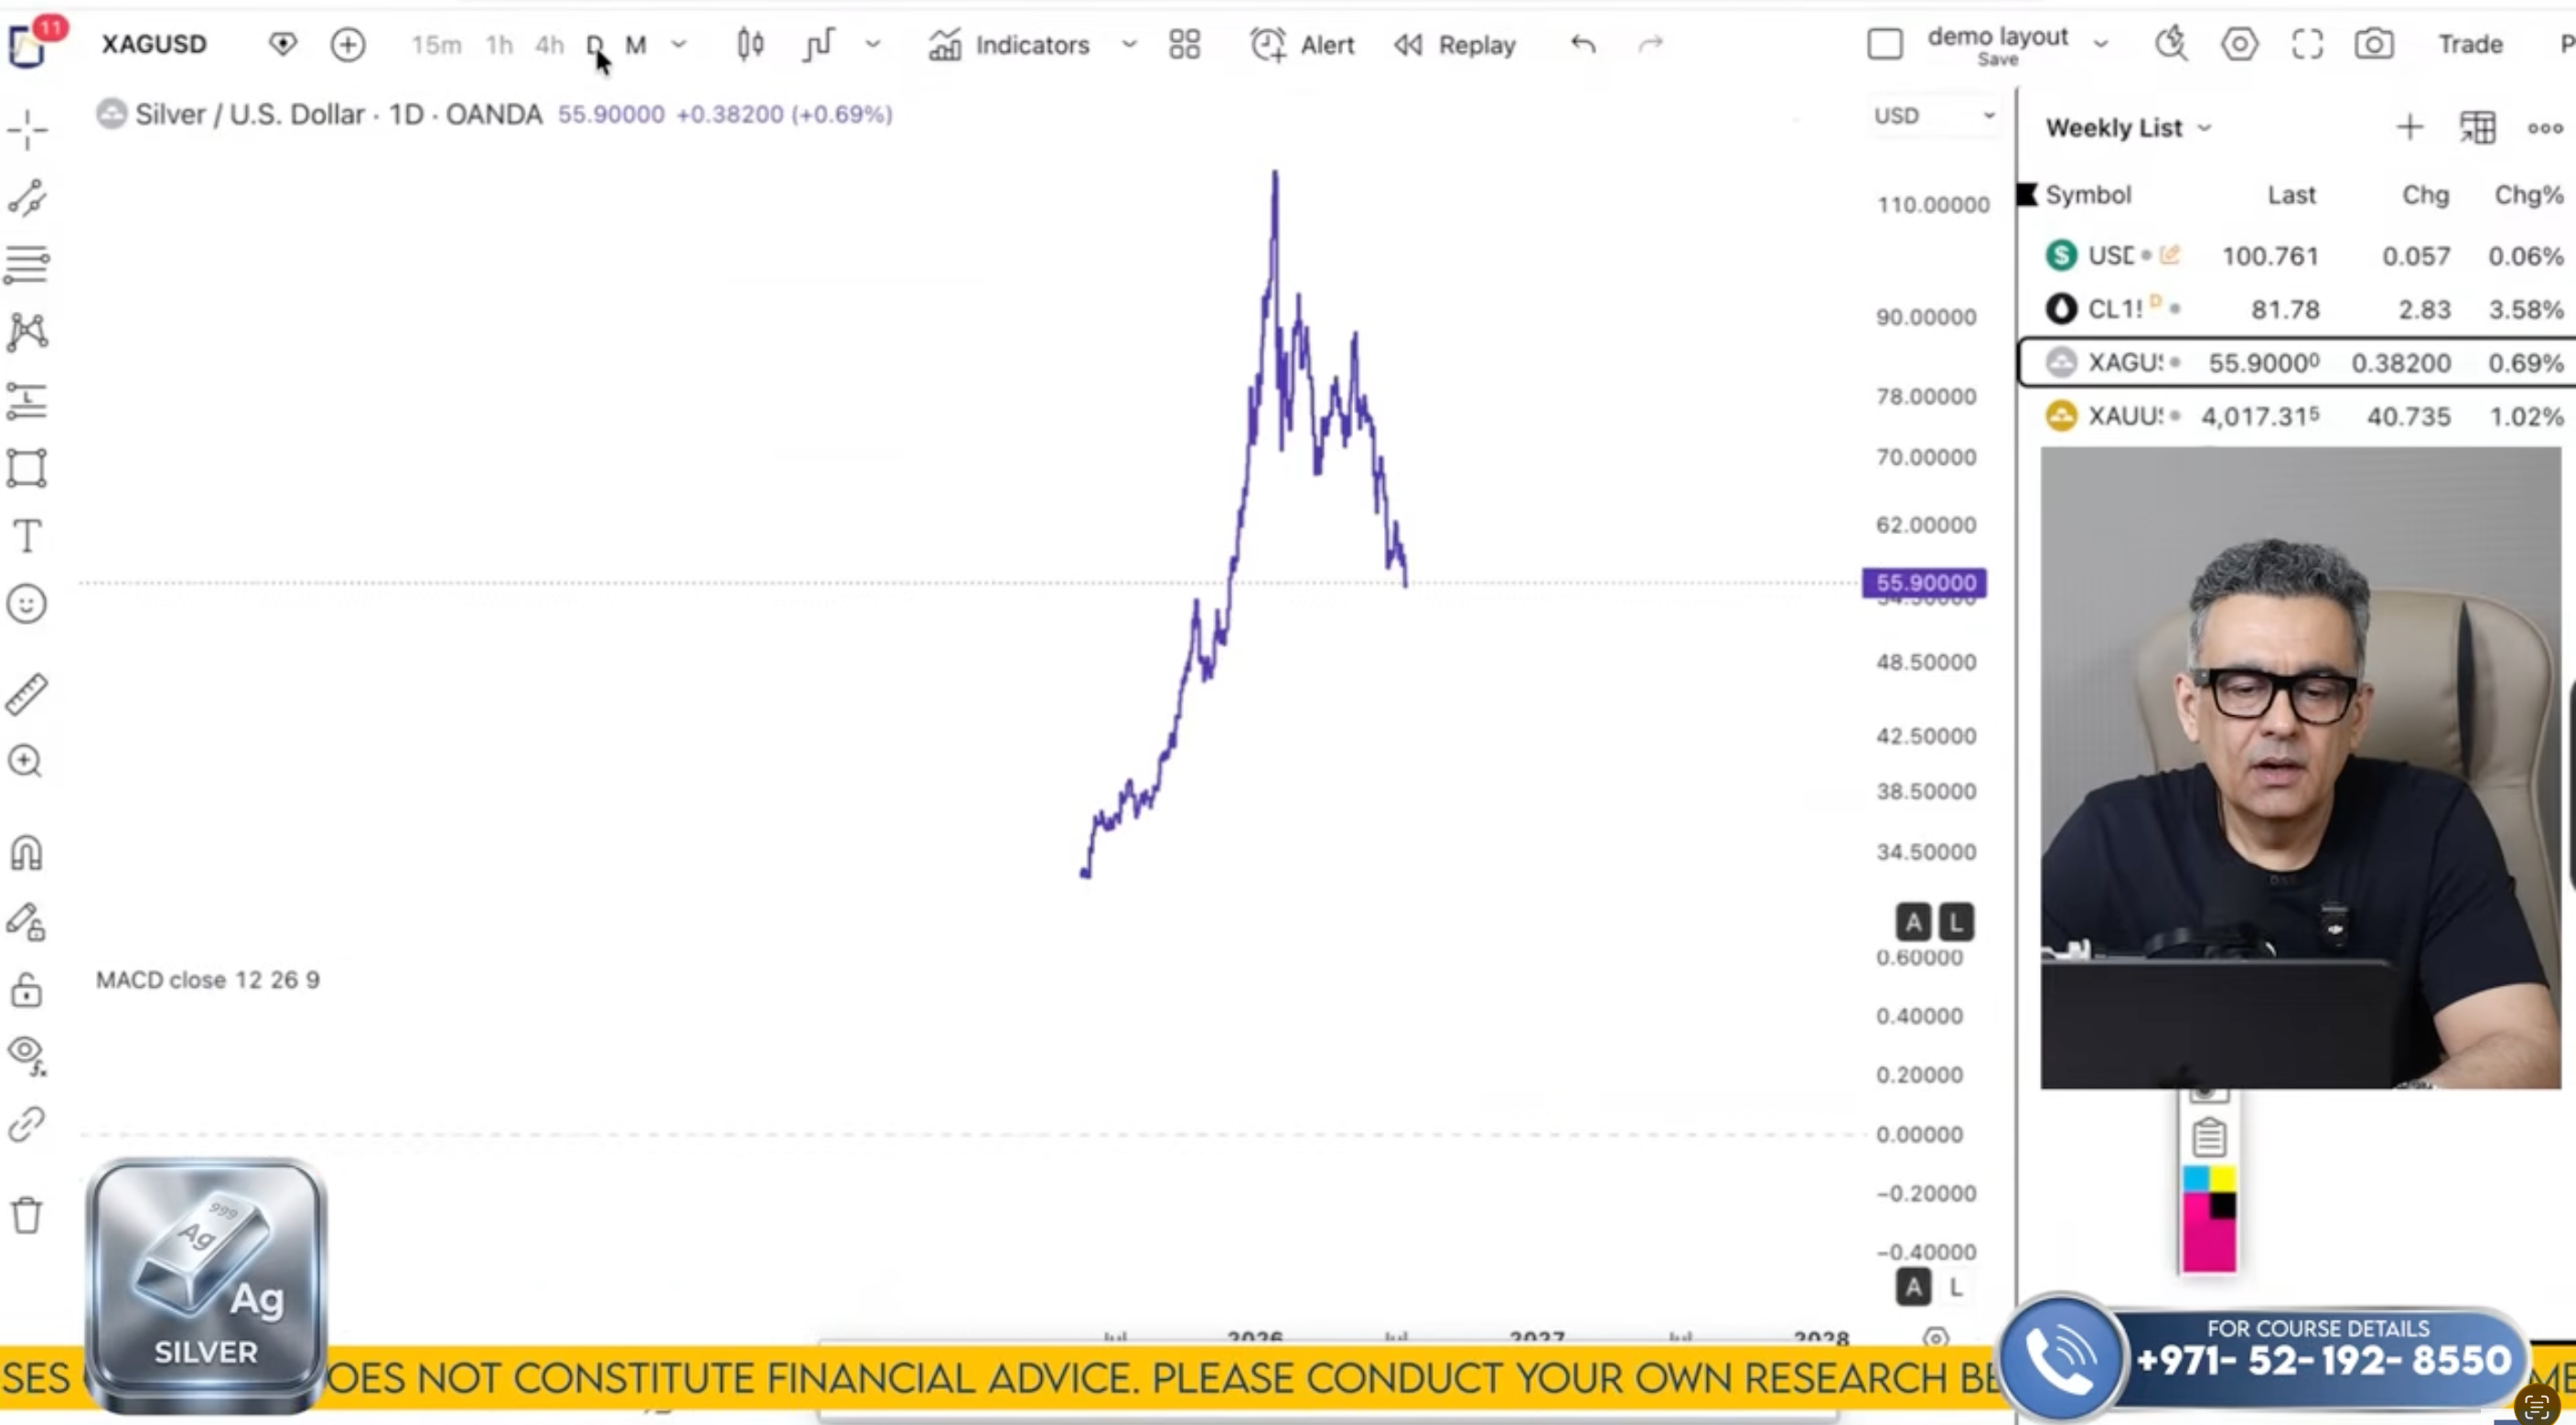
Silver is the weakest link of the four, and the honest read is that its structure still hasn't turned. Across the daily, four-hour and hourly, the run of lower highs and lower lows is intact, with price resting on a broad support shelf between 53.62 and 55.05 — tightening to 54.70–55.05 on the lower time frames.
There is one flicker of life: bullish divergence on the hourly has drained some urgency out of the selling, and the break-of-structure level to watch is 56.17. A bounce toward 56.90 or 57.38 is very possible — but Nikkhil reads it as a chance to sell, not to buy, unless price can break and hold above 56.90 and climb clear of its falling channel. The best case for buyers is a stretch into 58.36–58.66; short of a confirmed breakout there, he expects a rejection and a slide back toward the deeper 51.07 magnet. Exhaustion in the sellers, yes — reversal, not yet.
The question Friday really asked
When 3,972 gave way and price started sliding, what did you actually do? Be honest. For most traders the answer isn't in the chart — it's in the reaction: panic-selling the low, revenge-trading the bounce, nudging a stop and hoping. Friday wasn't a test of anyone's analysis. It was a test of discipline, and the market sets that exam every single week.
That's the reason TRADECHECX exists. It plugs straight into your MT4 or MT5 account and enforces the rules you've already set — no willpower required. Breach your daily loss limit and it locks you out. Reach your profit target and it protects it. And it hands you a TRADESCORE, a 300-to-850 discipline rating based on how you actually trade rather than how you imagine you do.
Signups are open now, with a 28-day free trial. https://score.tradechecx.com
Watch the TRADECHECX walkthrough
XAUUSD (GOLD)
Zoom out and the daily still reads bearish — the descent from the 4,850 resistance shelf remains the governing structure. That gives a clean map: resistance overhead at 4,541–4,564, then 4,214–4,258, with 4,089 as the nearer cap; and support below at the strong 3,880–3,882 magnet, then 3,762–3,793.
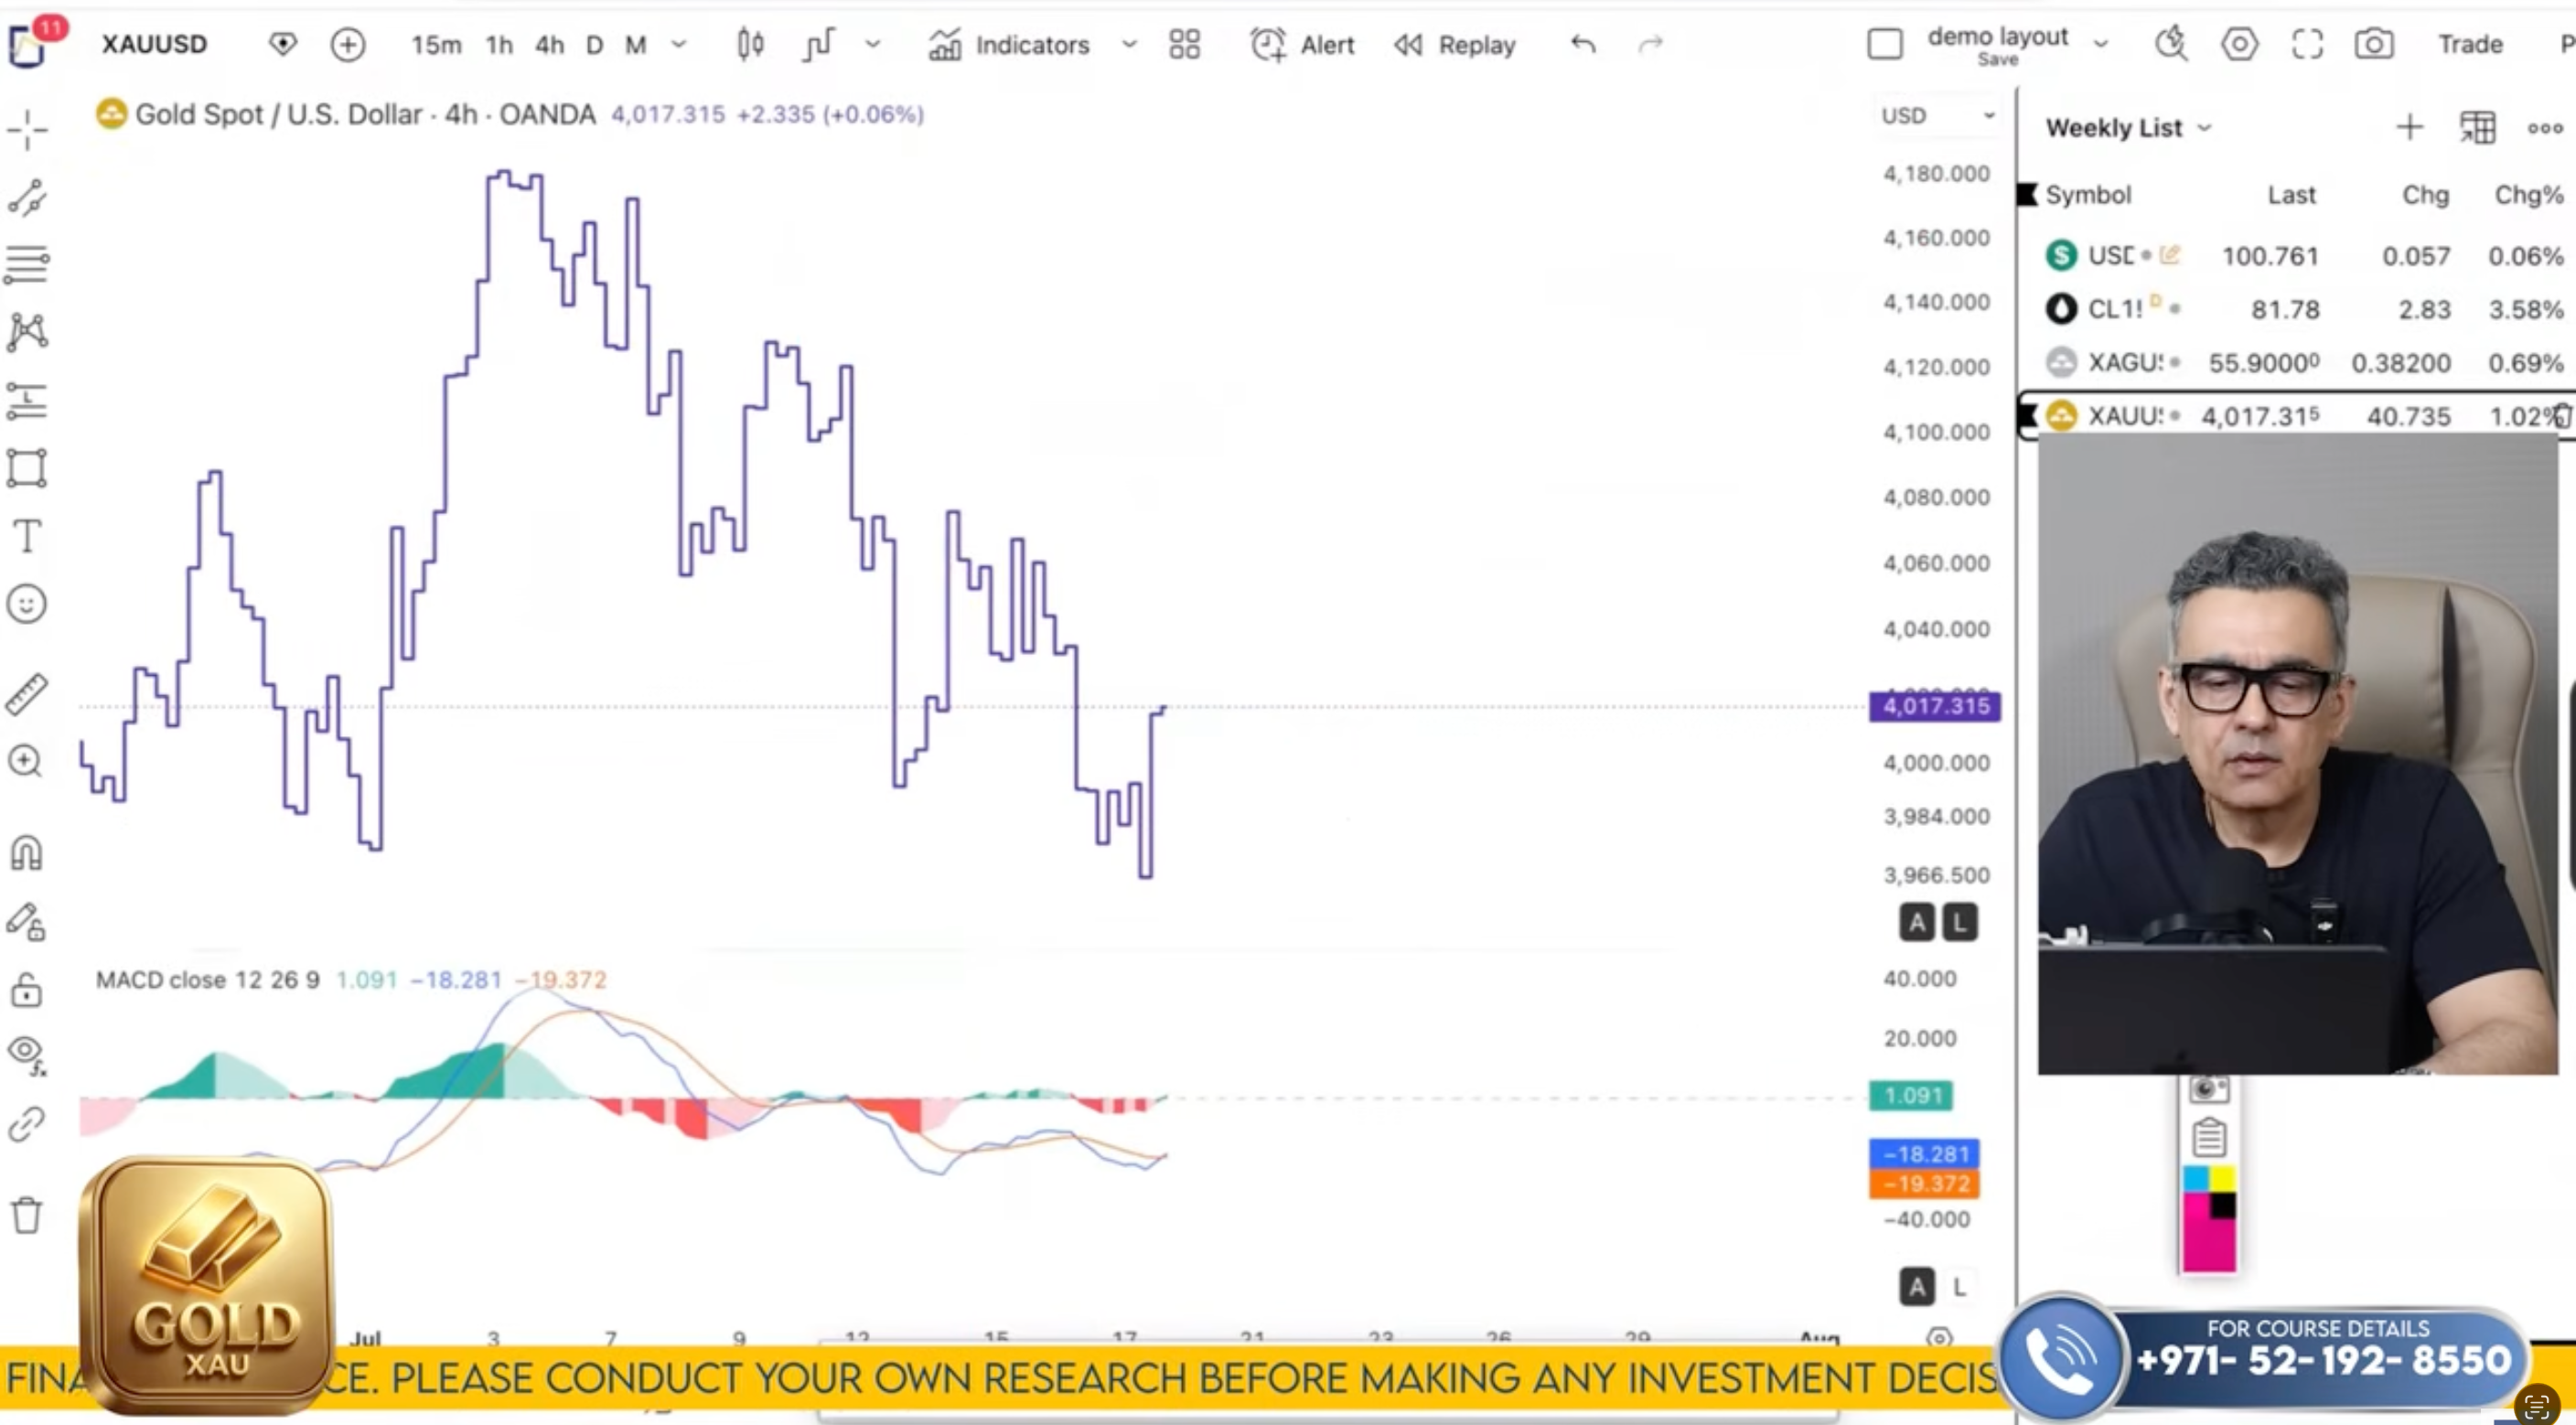
But the closer you look, the more the picture tilts. On the four-hour, gold built a double bottom, and the latest low arrived with bullish divergence — a tell that the sellers are tiring. The line that caps this bounce is 4,182; below it the structure is still technically bearish, but buyers now have a defined task: break 4,076. On the hourly, Friday's sharp recovery came immediately after the stops beneath 3,976 were swept, and price rebounded off the base of its falling channel. The first hurdle there is 4,039; the decisive one is 4,076, which doubles as the channel break.
Here is the two-level map from the open. Nikkhil expects a short-term bounce toward 4,038. Clear it, and 4,076–4,089 comes into play; fail to clear 4,089, and the falling channel likely drags gold back toward 3,887–3,890. Break above 4,089 convincingly, though, and the short-term bearish case is retired — the next objective becomes 4,182, and he'd look to buy retests rather than chase.
His own stance is unambiguous: no interest in shorting gold below 4,000, which he reads as a trap. He's accumulating buys beneath 4,000, prepared to hold even a dip to 3,887, and booking profits at 4,038, 4,075 and 4,089 — adding again on a retest if 4,089 gives way.
Coming up: no scheduled data headline anchors the week, so the levels are the event — and weekend news can shift the picture before Monday. The midweek live review lands Wednesday to mark every level against what price actually does.
Click here to watch the full Moneytize Forecast
The map is easy to state and hard to trade: gold above its floor and watching for the trigger, the dollar resting on its shelf, crude working through a corrective bounce, and silver still the laggard. A retest held on Friday — but holding once isn't the same as turning. 4,089 is the number that would make it real, and 3,880 is the line that keeps it honest.
The full breakdown is live on the Moneytize YouTube channel, and the Telegram link gets you into the group for real-time updates through the week
We’ll talk soon
Team Moneytize