

Welcome to the trading week of July 14th where the markets are reacting fast. Trump’s surprise delay on the July 9 tariff deadline, now pushed to August, paired with new proposals of 50% tariffs on copper and other imports has shifted sentiment across currencies, metals, commodities, and even altcoins. Nikkhil has isolated the key setups and the short window of opportunity where expectations and reaction could align perfectly. Here’s a guided look at what to focus on, including an explosive pattern in INJ/USDT. Let’s dig in.
US Dollar Index (DXY)
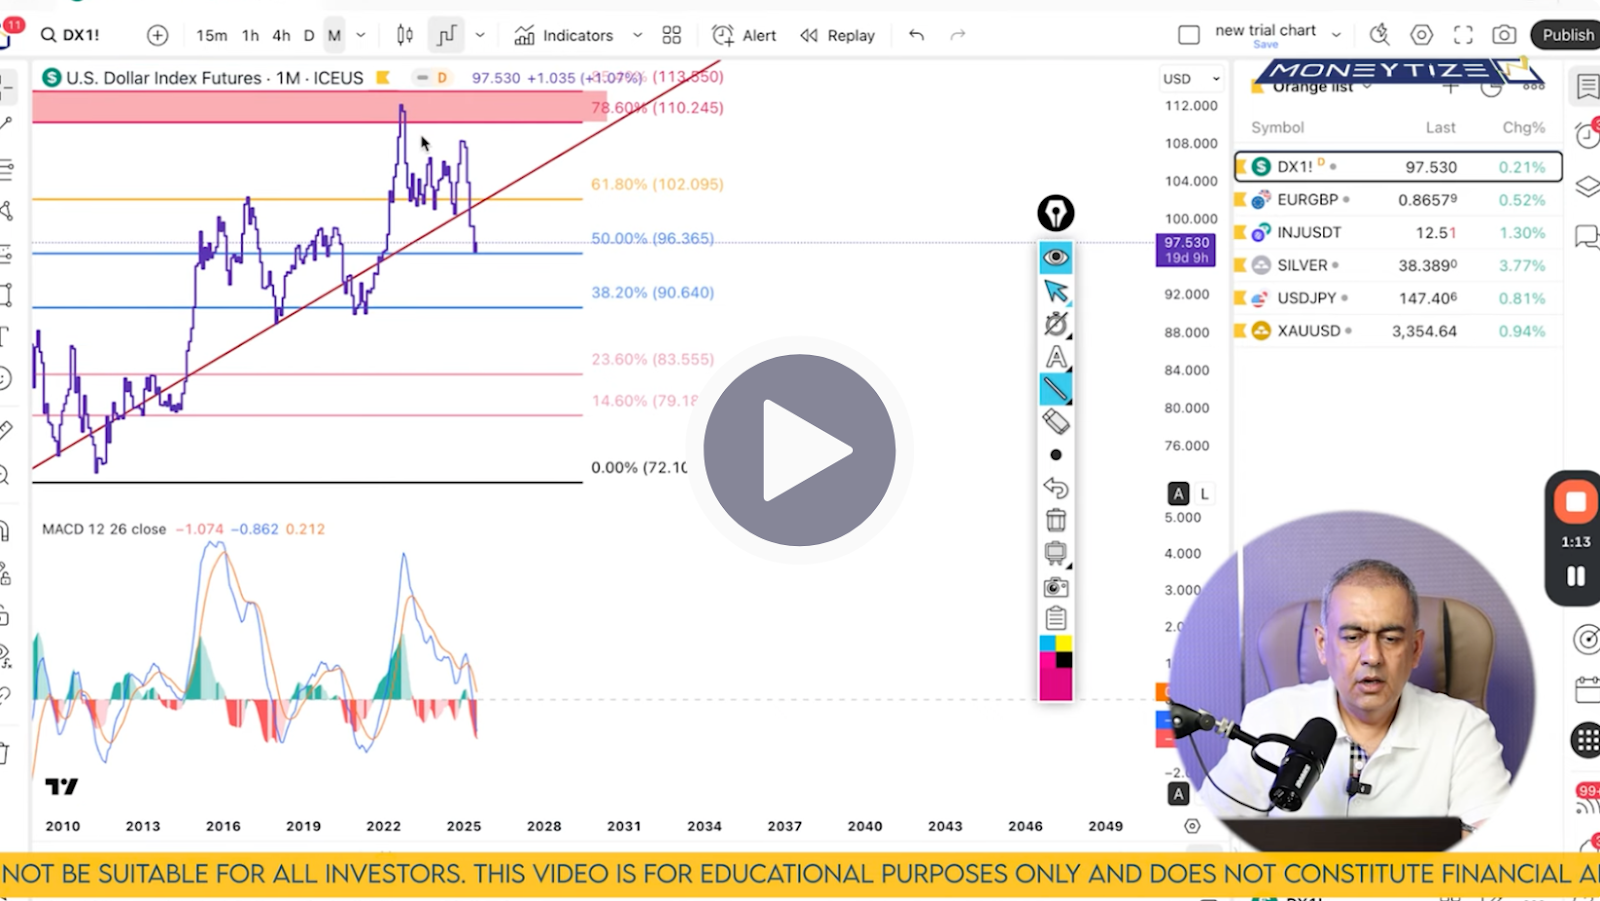
On the monthly timeframe, DXY recently broke a rising trend line after stalling in the 78.6 - 85.4% Fib zone, signaling sellers stepped in aggressively. That completed the bearish trend break. Next, a retracement is expected to the 50% Fib, which now acts as immediate support.
Zooming into weekly, the bearish momentum is fading, the MACD histogram is lightening up, hinting at exhaustion among bears. On daily, a clear double bullish divergence has formed, and price is testing a down-sloping trend line, breaking that would confirm a turnaround. Moving to 4-hour, an ABC bullish extension places confluence support at 97.86 - 98.05, with the next logical extension zone around 100.31 - 100.48. A catalyst in DXY could trigger a run to 98.30 - 98.50, with extension levels coming into focus afterward.
EUR/GBP
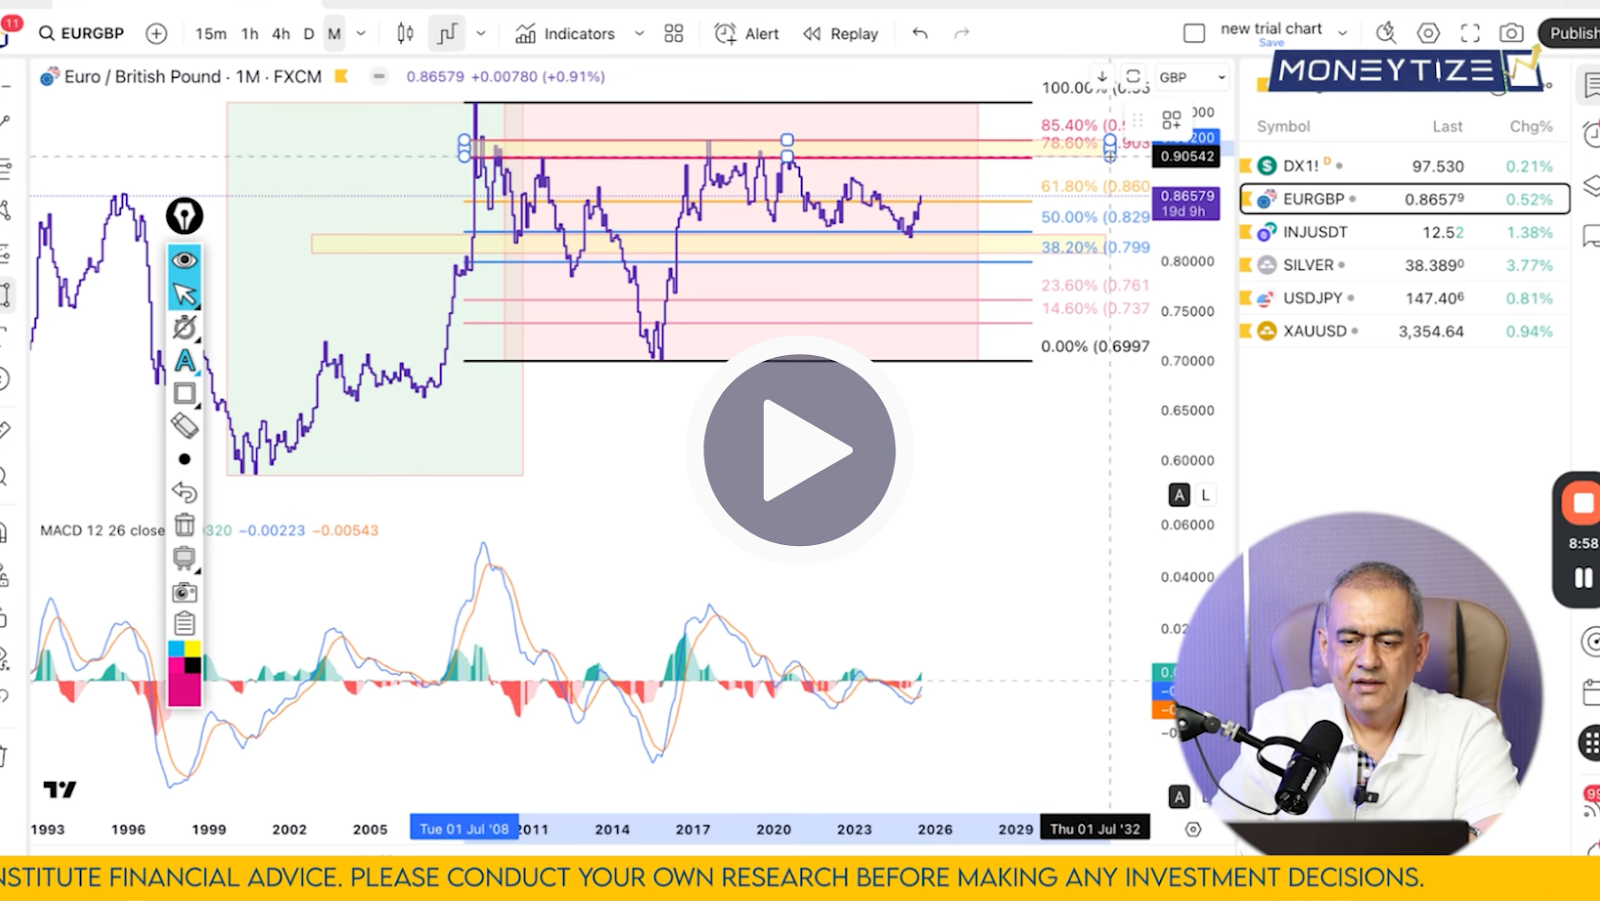
The monthly chart reveals a bullish backdrop, pulling back from an extended impulse only to hold around the 78.6 - 85.4% Fib area - followed by strong support and a clear bullish divergence. A potential down-sloping trend-line is about to break. On the weekly, buyers have confirmed structure with bullish divergence and higher highs. An ABC bullish extension points to 0.8653 and then into the 0.8830 zone.
The 4‑hour chart supports this - bullish divergence, clean structure, and an ABC extension cluster all converging near 0.8750 as the first target, extending to 0.8830. A minor pullback is expected from 0.8750, but dips should be treated as buy setups, with 0.8830 as the ultimate upside zone.
INJ/USDT (Injective)
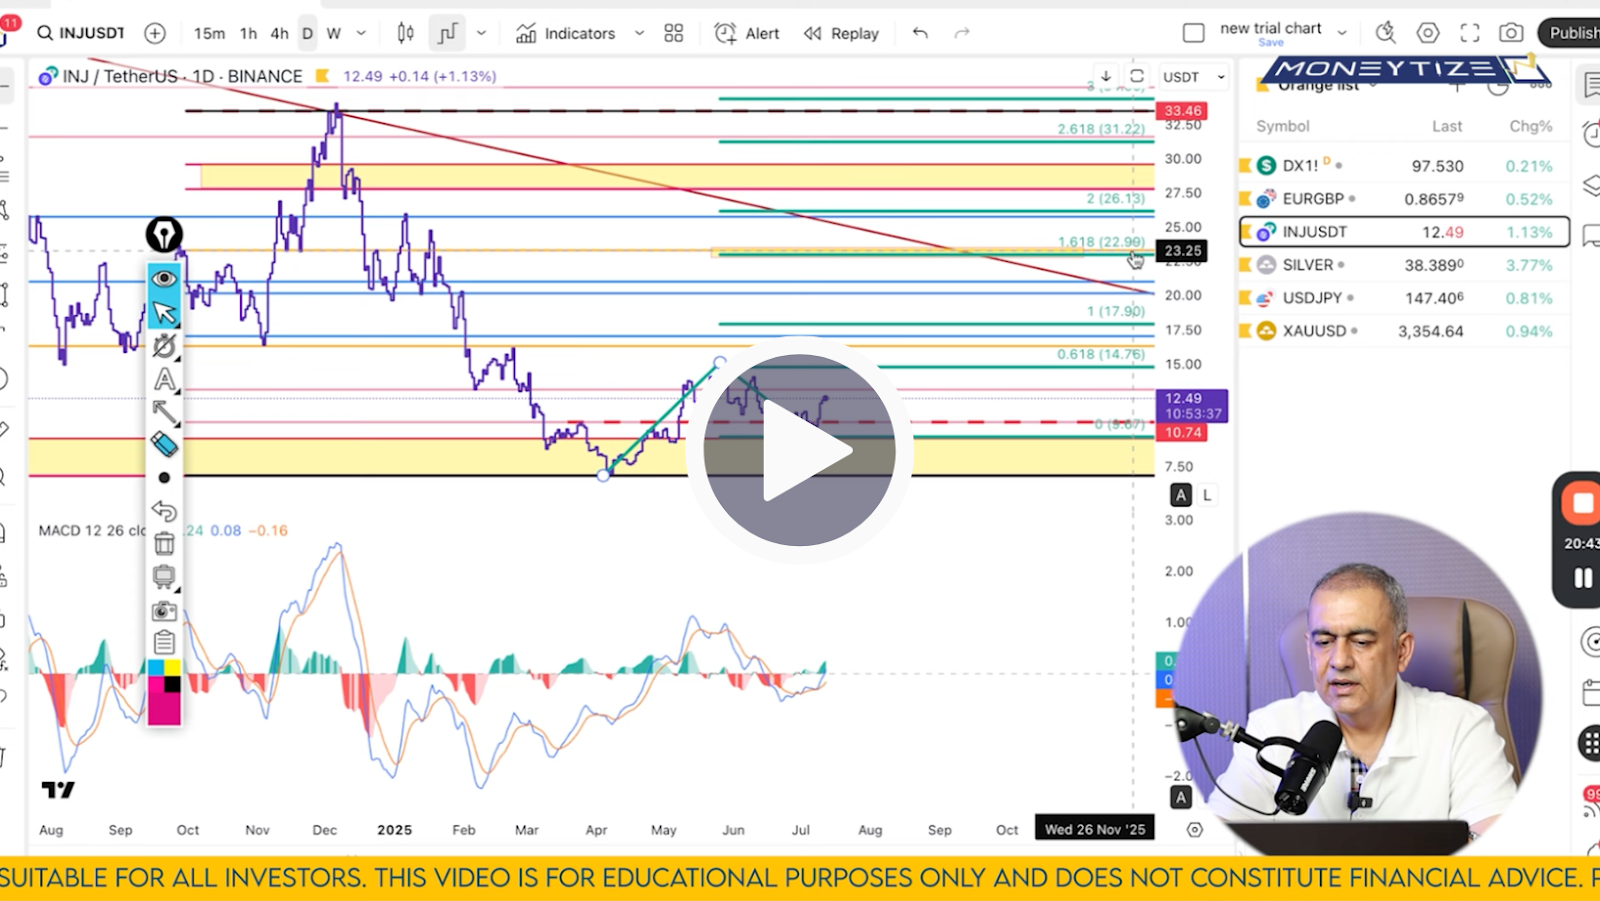
Injective is showing textbook bullish structure. Monthly retracement held within the 78.6 - 85.4% Fib on its 3rd wave, followed by a weekly bullish divergence. Daily confirms a breakout with structure retest complete, and ABC extension targets the 61.8% level, with upside price confluence between $17.90 and $23. That equates to 40 - 80% potential gains from $12.50.
Silver
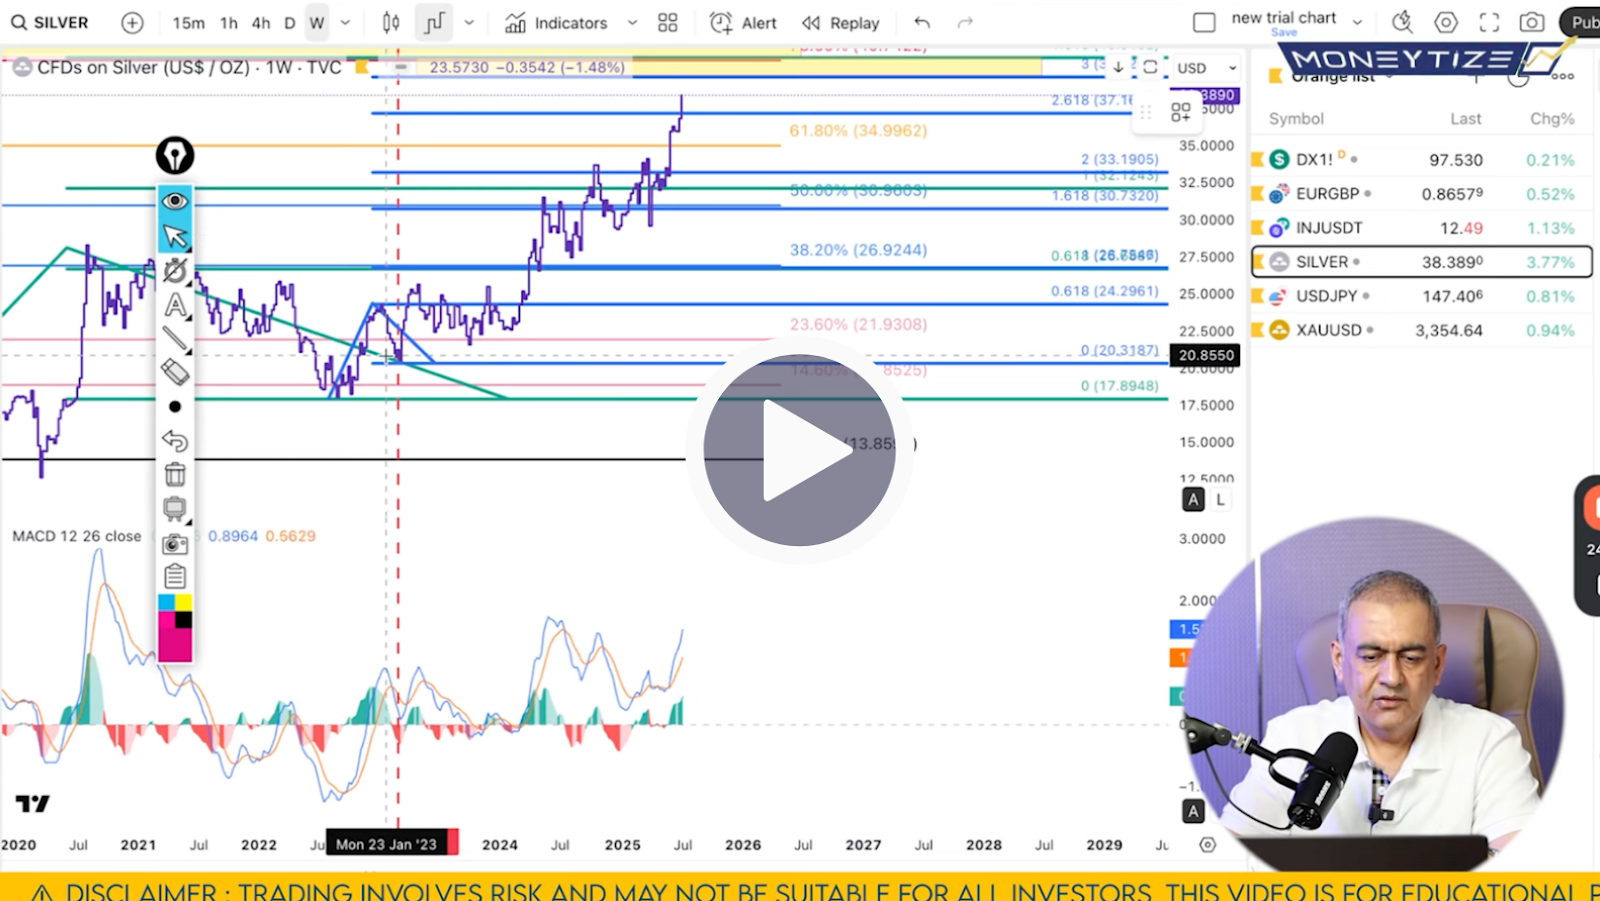
On the monthly, silver remains in a strong bullish structure. Price is currently trading around $38.38, which is below the major Fib resistance zone of $40.74 - $43.06. This zone marks a key magnet where multiple Fib extensions and retracements converge, making it a logical upside target as the next leg unfolds.
The weekly chart reinforces this view, with bullish MACD momentum and no sign of exhaustion. Silver is building strength toward $39.62 - $40.74, with a potential extension to $43.06 from there.
On the daily and 4-hour frames, structure remains firmly bullish. We’re seeing higher highs across both price action and MACD, and no signs of divergence. Any pullback toward $36.00 would present a buying opportunity, with Nikkhil’s initial target set at $40.90, followed by potential continuation into the low-$40s
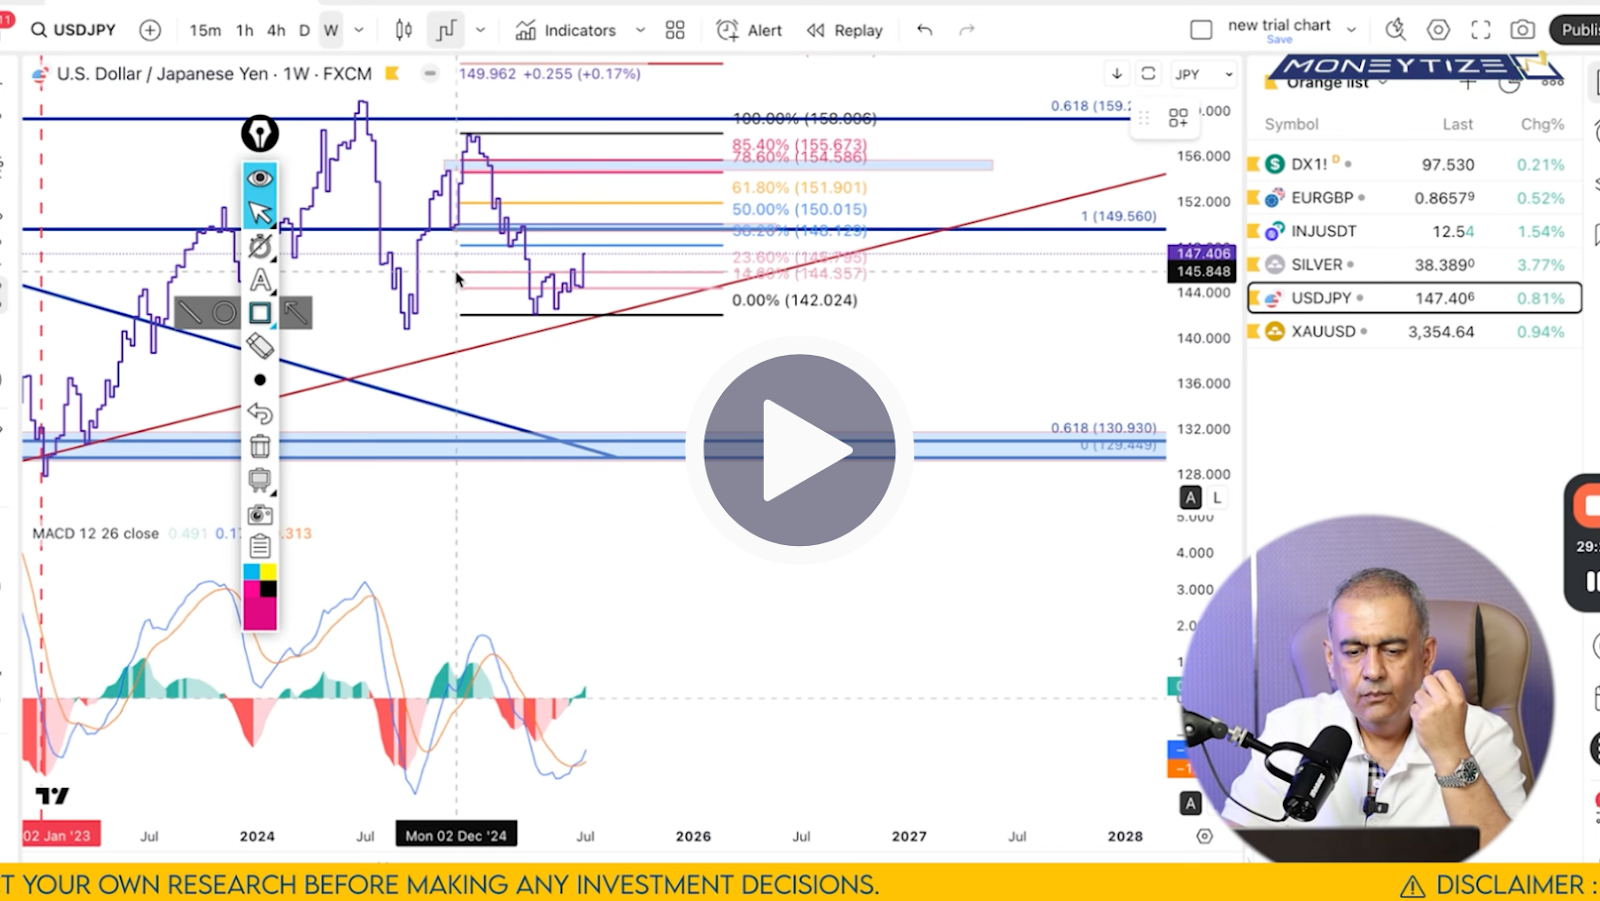
USD/JPY
The monthly structure remains bullish, buyers holding key rising trend line support. Beware of a bearish divergence on the highs, but trend-line support remains untouched. On weekly, the rising trend line is intact, with next resistance around 148.1 - 150.0 (Fib levels).
A daily ABC extension targets 149.56 - 150.28, contingent on remaining above 144.33. The 4‑hour chart holds above 146.63 - with an extension to 149.38. Any dip should be used to buy into momentum for a potential move toward 150+. A decisive break below 144.35 invalidates the bullish setup.
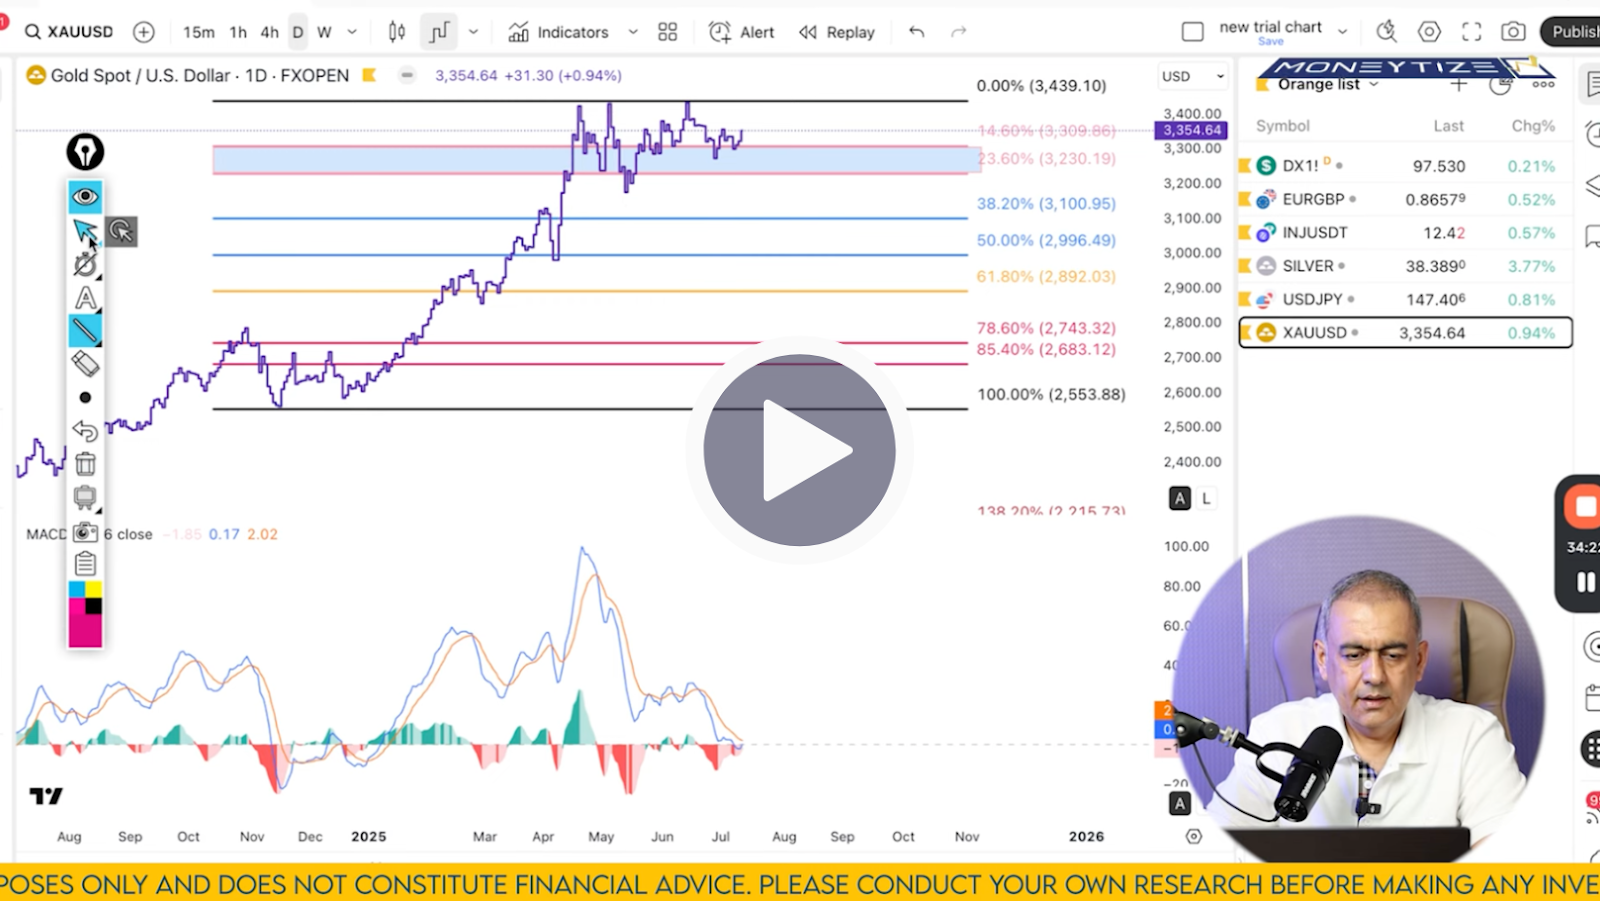
Gold (XAU/USD)
Gold remains in a bullish macro trend, but short-term correction is underway. The weekly Fib retracement shows price testing above the 14.6% retrace ($3,309), while daily structure indicates price building a healthy consolidation. The structure suggests sellers could keep pressure near $3,340 - $3,416 (4‑hr Fib zone). A breakdown below $3,340 might push gold to $3,256, $3,214 or even $3,190 before resuming upward momentum.
In short: clean setups exist for selling rallies into $3,340 - $3,416. A strong daily or 4‑hour close above $3,416 would negate bearish setups and reopen bullish continuation strategies.
Tariff headlines have kicked off volatility across DXY, EUR/GBP, USD/JPY, gold, silver - and yes, even altcoins. These technical setups don’t rely on hype, but on measured reactions when key levels are tested. Have your plan in hand and your trigger in place.
Click here to watch the full Moneytize Forecast
Stay disciplined, follow the levels, and execute with confidence. Let Nikkhil’s chart maps guide your moves this week.
Talk soon,
Team Moneytize