

Welcome to this week’s Forex Forecast. Gold smashed 4,621 exactly as we predicted last week, and now it’s consolidating right at a key Fibonacci extension level. Before we dive into this week’s setups, let’s recap what’s been unfolding and why we’re at a critical juncture: Gold has reached the 100% FIB extension at 4,623, hitting the target range of 4,621 - 4,628 Nikkhil highlighted in the weekly video. Instead of rolling over sharply, price is consolidating - and that matters. We’ve entered what he calls a danger zone where traders who think the move is over may be setting themselves up for a big mistake. A corrective drop could revisit earlier support around 4,500 - 4,550, but the real story this week is the market fuel we have ahead, including the US President’s speech, a Bank of Japan rate decision, US GDP and PCE inflation releases, and CPI from the Eurozone and UK. These catalysts can generate aggressive moves across major instruments.
Let’s break it all down and prepare strategically.
DXY (U.S. Dollar Index)
The dollar index has started a corrective bounce after losing bearish momentum. On the weekly chart, price cleared a series of higher lows and higher highs, and the MACD histogram is rising again, signaling short-term strength. On the daily and 4‑hour frames, corrective bullish structures and duplicating fib levels point to a potential rally toward 99.80, and if that resistance is cleared, 101.54 - 101.66 becomes the next magnet. This move can still reverse once it exhausts corrective strength, but for now, the short-term setup is tilted bullish.

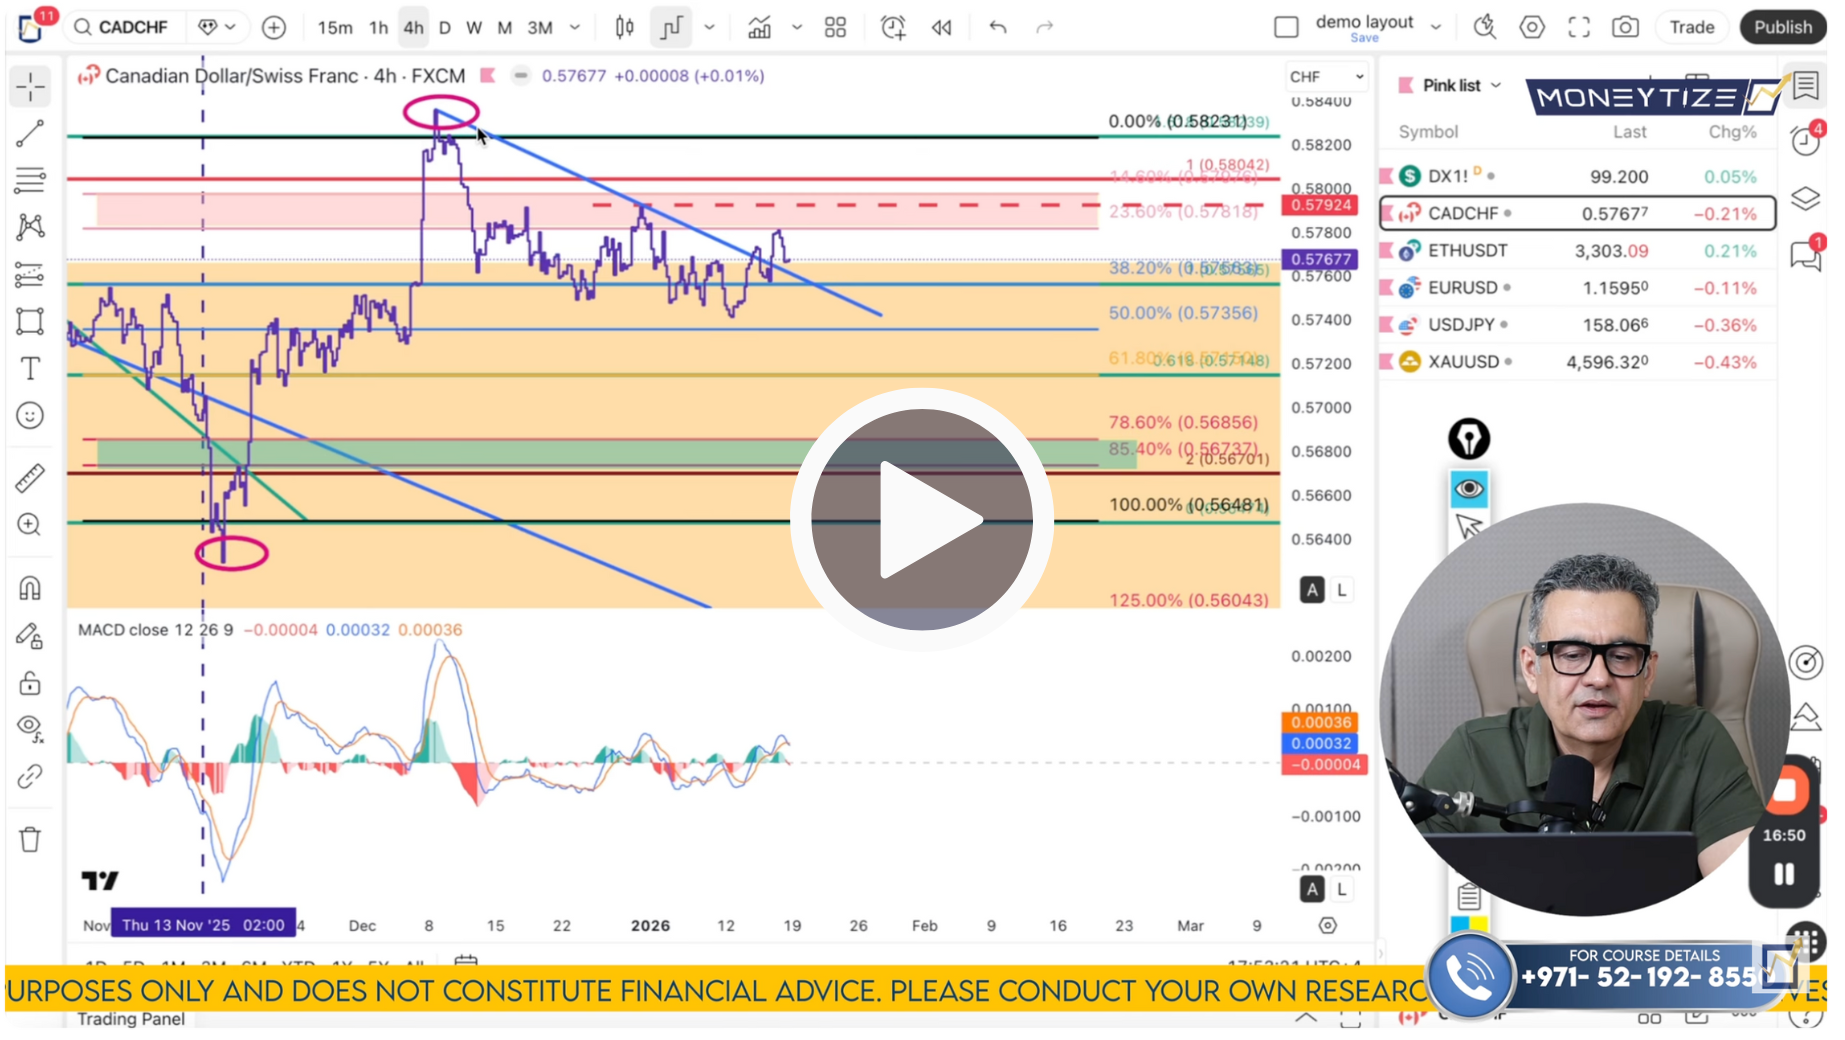
CADCHF (Canadian Dollar / Swiss Franc)
Quantum analysis and chart structure are aligned in favor of buyers here. Long‑term, the pair has shown weakening bearish momentum at magnet support zones and early signs of bullish divergence. On the weekly and daily charts, a series of higher highs and higher lows confirms a developing bullish trend, and the next extension targets sit above current price. Support zones near 0.5673 will be key; any dip should be treated as a buying opportunity with the first magnet near 0.5868, followed by 0.5948.
ETHUSD (Ethereum / USD)
Ethereum remains structurally bullish. The monthly frame has higher lows and higher highs, and weekly retracement dropped precisely to the 61.8% level, which is a classic corrective pivot. On the daily chart, the retracement bounce from 2,752 and the magnet zone around 6,200 remains intact. This gives a strong risk/reward as long as price stays above the weekly support at 2,030. Nikkhil’s accumulating on weakness for a continuation higher.

EURUSD (Euro / U.S. Dollar)
With DXY showing corrective strength, Euro has come under short‑term bearish pressure. Quantum trend scores favor sellers across timeframes, and price has failed to sustain above the 100% FIB extension on the weekly chart. On the daily frame, bearish divergence has emerged, and downside extensions target 1.1557, potentially stretching toward 1.1490 if selling continues. A break back above 1.1694 - 1.1703 would invalidate the bearish plan and signal potential short covering.

USDJPY (U.S. Dollar / Japanese Yen)
There’s a short‑term contradiction between lower‑timeframe bearish signals and higher‑timeframe long structure in USDJPY. Monthly structure remains bullish, but daily shows probable bearish divergence and short‑term resistance. With a Bank of Japan announcement this week, volatility risk is elevated. A drop toward support near 156.18 could be a buying opportunity, with targets around 159.96 - 160.00 and beyond if the trend holds.

XAUUSD (Gold)
Gold’s long-term trend remains bullish, but hitting the 4,620+ resistance area places price in a short-term danger zone. Weekly and monthly structures continue to show rising momentum; however, 4498 - 4500 is the key short-term support band buyers must defend. A confirmed break below 4498 - 4500 opens the door for a deeper retest into the 4454 - 4468 support zone, where buyers are expected to step in. As long as this broader structure holds, continuation toward 4,686 and beyond remains on the table.

This week’s lineup of data and policy events has serious fuel to move markets fast.
Trade with discipline, use clear invalidation levels, and avoid chasing price.
Click here to watch the full Moneytize Forecast
We’ll talk soon
Team Moneytize