

Welcome back to our new weekly forecast for the trading week starting January 12th. Gold has already made its decision and that decision is bullish. A weekly close above the major psychological 4,500 level has decisively shifted the balance in favor of buyers. What matters now isn’t if gold wants to rally, but how far this move can extend. With CPI week ahead, this setup is clean, structure remains intact, and gold is pressing into a zone where upside momentum can accelerate quickly. In this forecast, Nikkhil will walk you through what needs to hold for gold to unlock its next leg, what could spell an outright failure, and a full technical read on the US Dollar Index, USD/JPY, silver, and crude oil. Nikkhil walks you through what he sees for key instruments and where he's watching closely.
DXY (U.S. Dollar Index)
Let’s begin with the Dollar Index. The daily structure has turned bullish following a double bottom with bullish divergence. This kicked off a corrective leg higher, now unfolding in a clear ABC extension sequence. The first magnet lies at 99.45, with higher zones visible at 99.81, the psychological 100.00 mark, and then 101.45. The 4H and 1H timeframes confirm bullish momentum, with local support at 98.52 and key breakout resistance at 99.40 - 99.45. As long as buyers remain in control above these zones, a full push toward 101.33 - 101.45 is in play. However, this remains a corrective bounce within a larger bearish structure, so keep expectations measured. This level could trigger a big reaction.

USD/JPY
Over to USDJPY, which has shifted decisively bullish after breaking out of its triangular consolidation on the weekly chart. With higher highs and higher lows forming across the daily and 4H timeframes, all signs point to continuation. Support sits at the psychological 155 level, and the next bullish magnets are clustered around 158.85, 160.50, and eventually 162.78 to 163.00. Momentum remains strong, and any dips into the 156.45 zone are likely to be buying opportunities, not signs of reversal. The entire structure remains intact as long as that level holds.

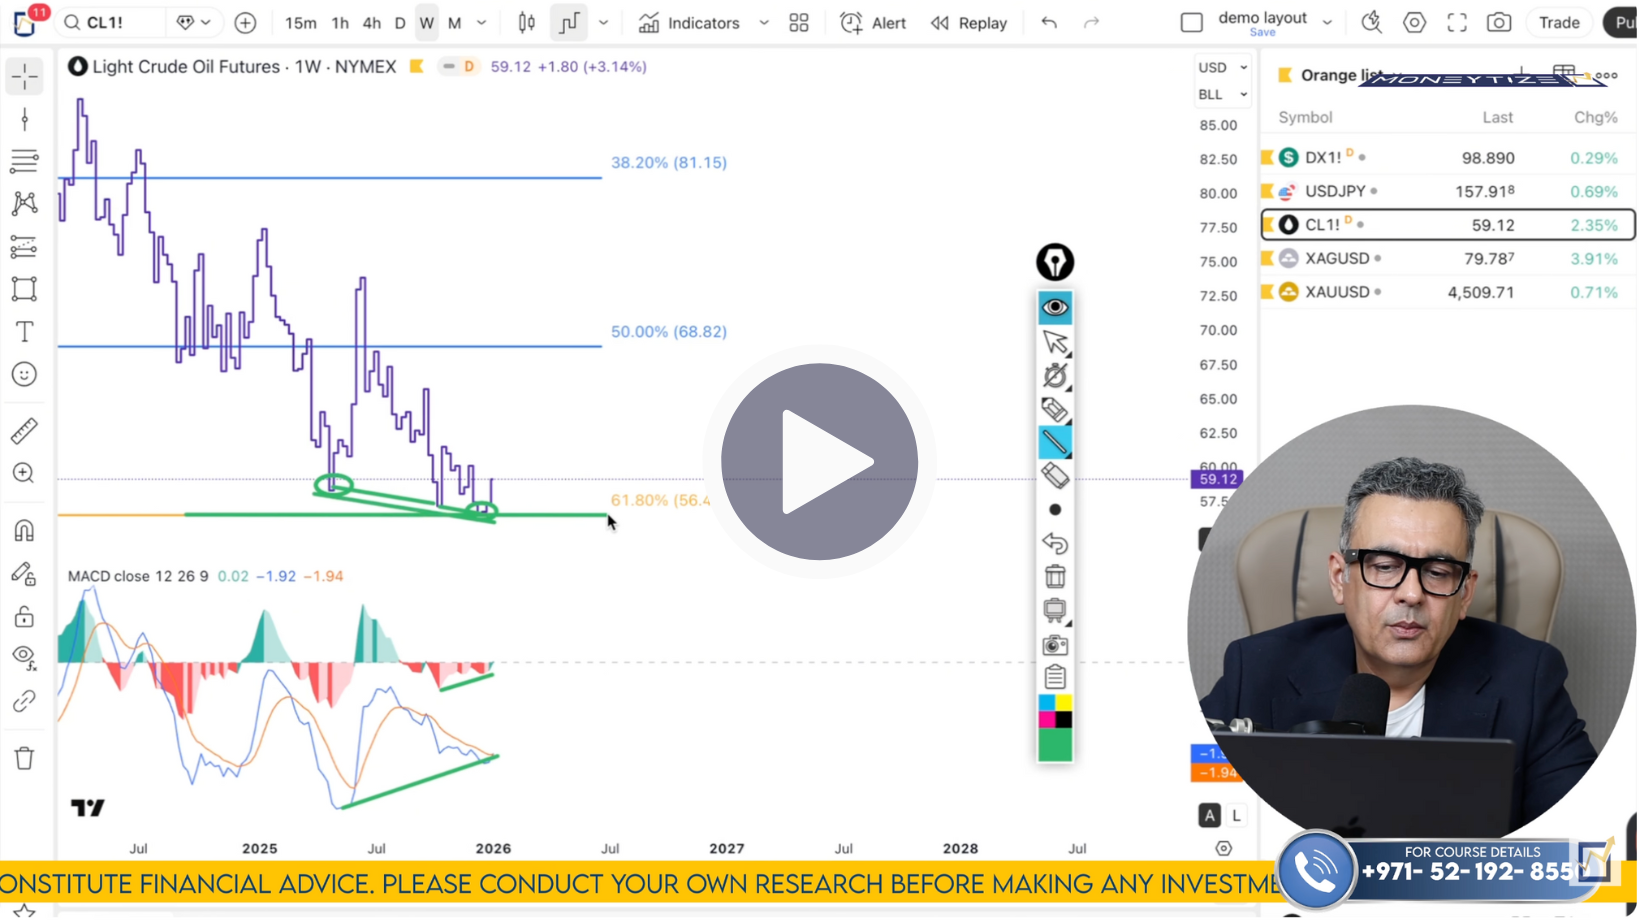
Crude Oil
Next is crude oil, which just bounced sharply from the 61.8% fib retracement on the weekly chart - a key support area. Bullish divergence on the histogram confirms the shift, and price is now testing the 100% fib extension on the 4H chart at $59.41. A short-term pullback is expected, potentially toward the $58 level, before continuation higher. As long as $56.47 holds, this remains a bullish accumulation zone. Targets ahead are 61.54, 62.86, and eventually the $65 handle, where confluence from multiple fib levels aligns. This is one of the cleanest risk-to-reward plays on the board.
Silver
Silver continues to impress with a powerful bullish structure across all timeframes. The weekly and daily charts show a sequence of higher highs supported by strong MACD momentum, with no divergence suggesting reversal. Price recently hit resistance at 80.19 and could dip toward the 74.25 zone - a key buy region. As long as 74.88 holds, the trend remains intact. Targets to the upside are 83.87 to 84.68, followed by 89.82 and eventually 93.63.

Gold
And finally, gold. After a decisive weekly close above 4,500, price is now pressing into a magnet zone near 4,550. Short-term pullbacks could be seen, but key support sits at 4,487, then 4,432, and ultimately 4,410. Any drop into these levels is likely to be a buying opportunity. The next upside targets sit at 4,572, 4,593, and a very strong confluence zone around 4,620 to 4,628. Unless 4,410 breaks, the bias remains firmly bullish, and momentum continues to build on all lower timeframes.

Watch the full breakdown now and get your plan in place before the herd reacts.
Click here to watch the full Moneytize Forecast
We’ll talk soon
Team Moneytize