

Welcome back to our new weekly forecast for the trading week starting December 8th. With major rate decisions looming from the Federal Reserve (Fed), Reserve Bank of Australia (RBA), Bank of Canada (BoC) and Swiss National Bank (SNB), volatility is coming. As a trader, you need to be positioned, but prepared for possible false moves and sharp reaction swings. Nikkhil walks you through what he sees for key instruments and where he's watching closely.
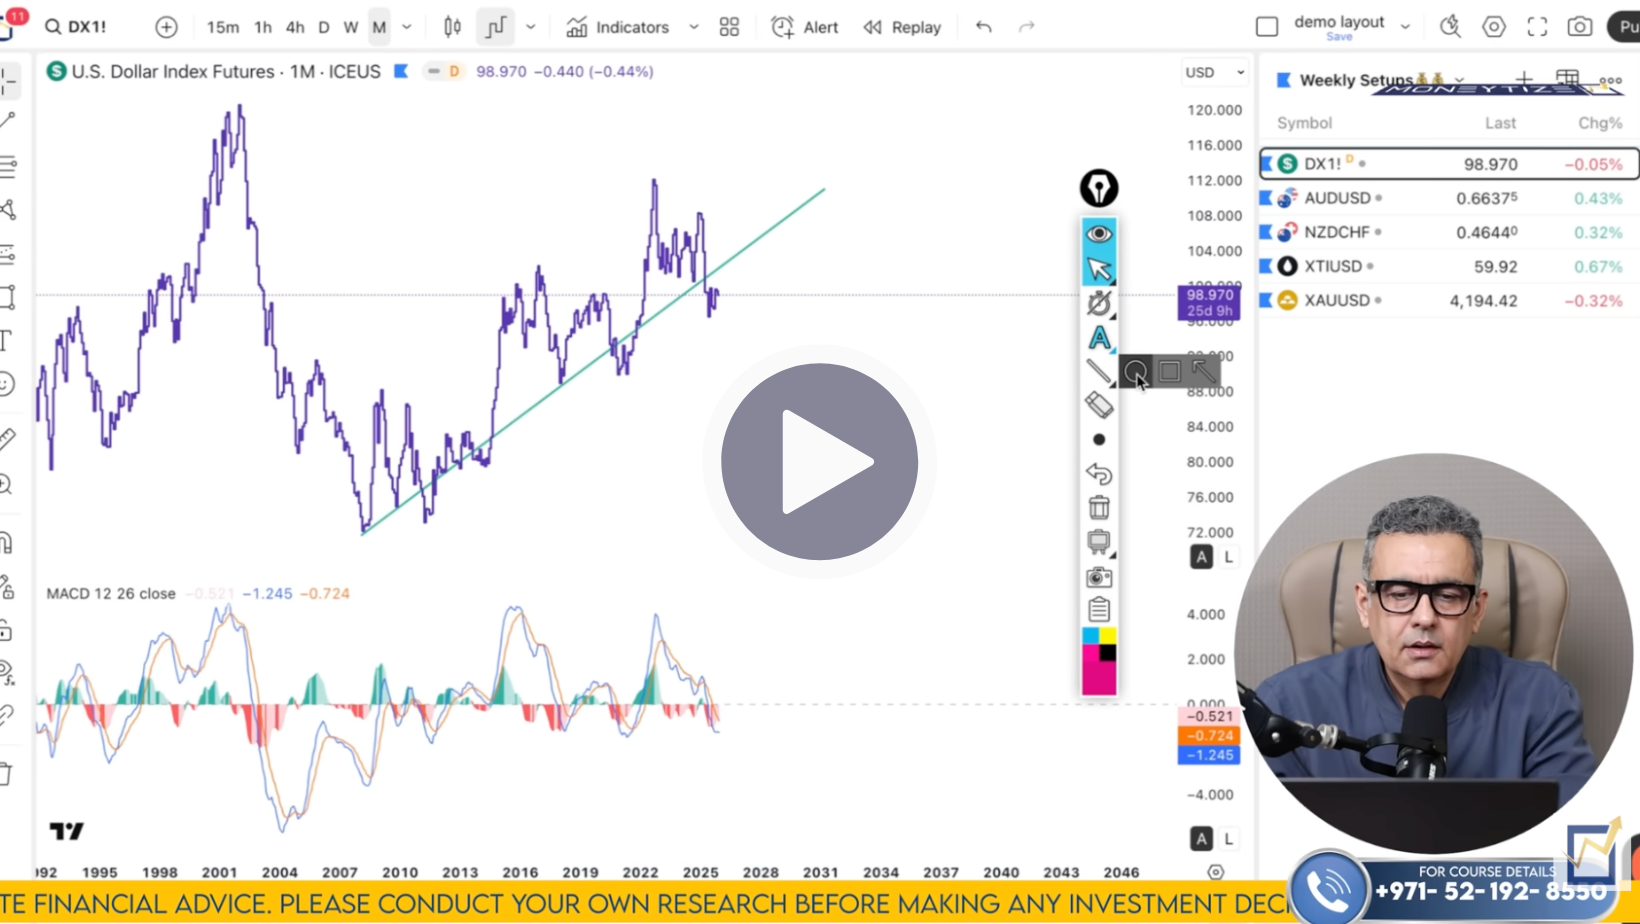
DXY (U.S. Dollar Index)
On the monthly chart, DXY broke below its rising trend line - a big structural change. On the weekly, price action continues to display lower‑low structure and bearish momentum, while on the daily there’s bearish divergence even after a recent bounce. That suggests the broader trend remains dollar‑bearish over the medium term.
That said, with the Fed rate decision this week, we could see a short‑term spike, perhaps into the 101.11 / 101.47 - 102.05 resistance zone. If we get that spike and DXY fails to hold above it, Nikkhil expects a resumption of the down‑move, targeting 96.63 initially, then possibly 94.25.
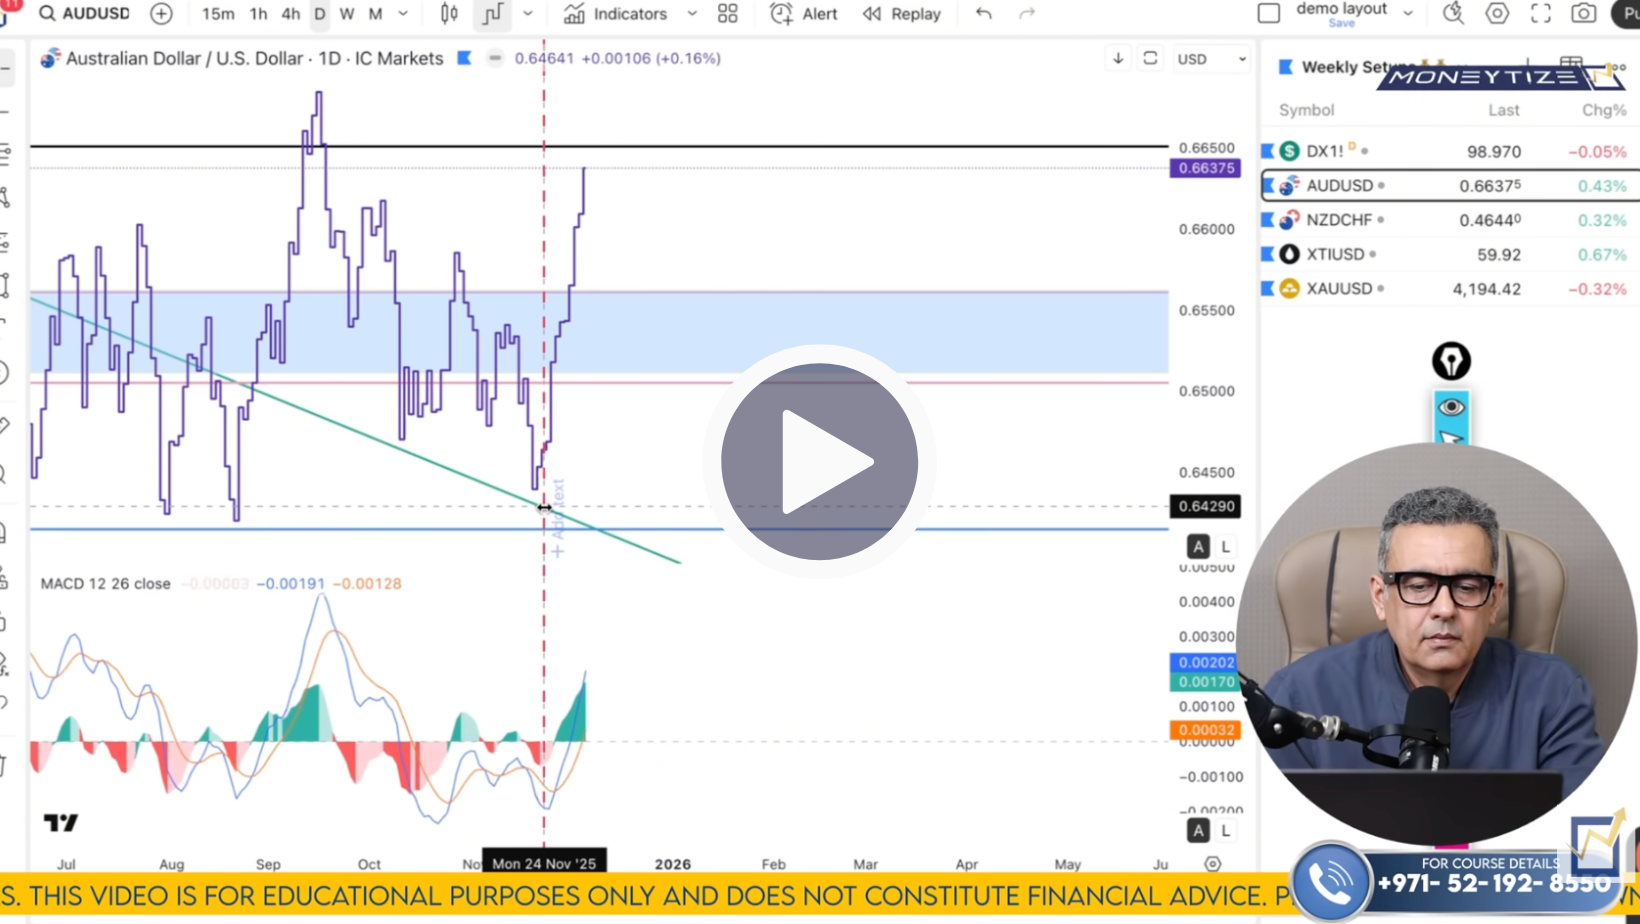
AUD/USD (Australian Dollar vs. US Dollar)
On higher timeframes, AUD/USD is set up beautifully. Monthly and weekly charts show a completed double‑bottom with bullish divergence, and the corrective down‑leg appears to have reversed. On the daily chart the bullish trend seems to be resuming.
If AUD/USD pulls back, perhaps as markets digest central‑bank noise, Nikkhil’s watching for entries around 0.6540, with deeper risk-based entries near 0.6520 - 0.6500. First major target sits at 0.6891, with a longer‑term ambition up in the 0.7170 - 0.7200 area.
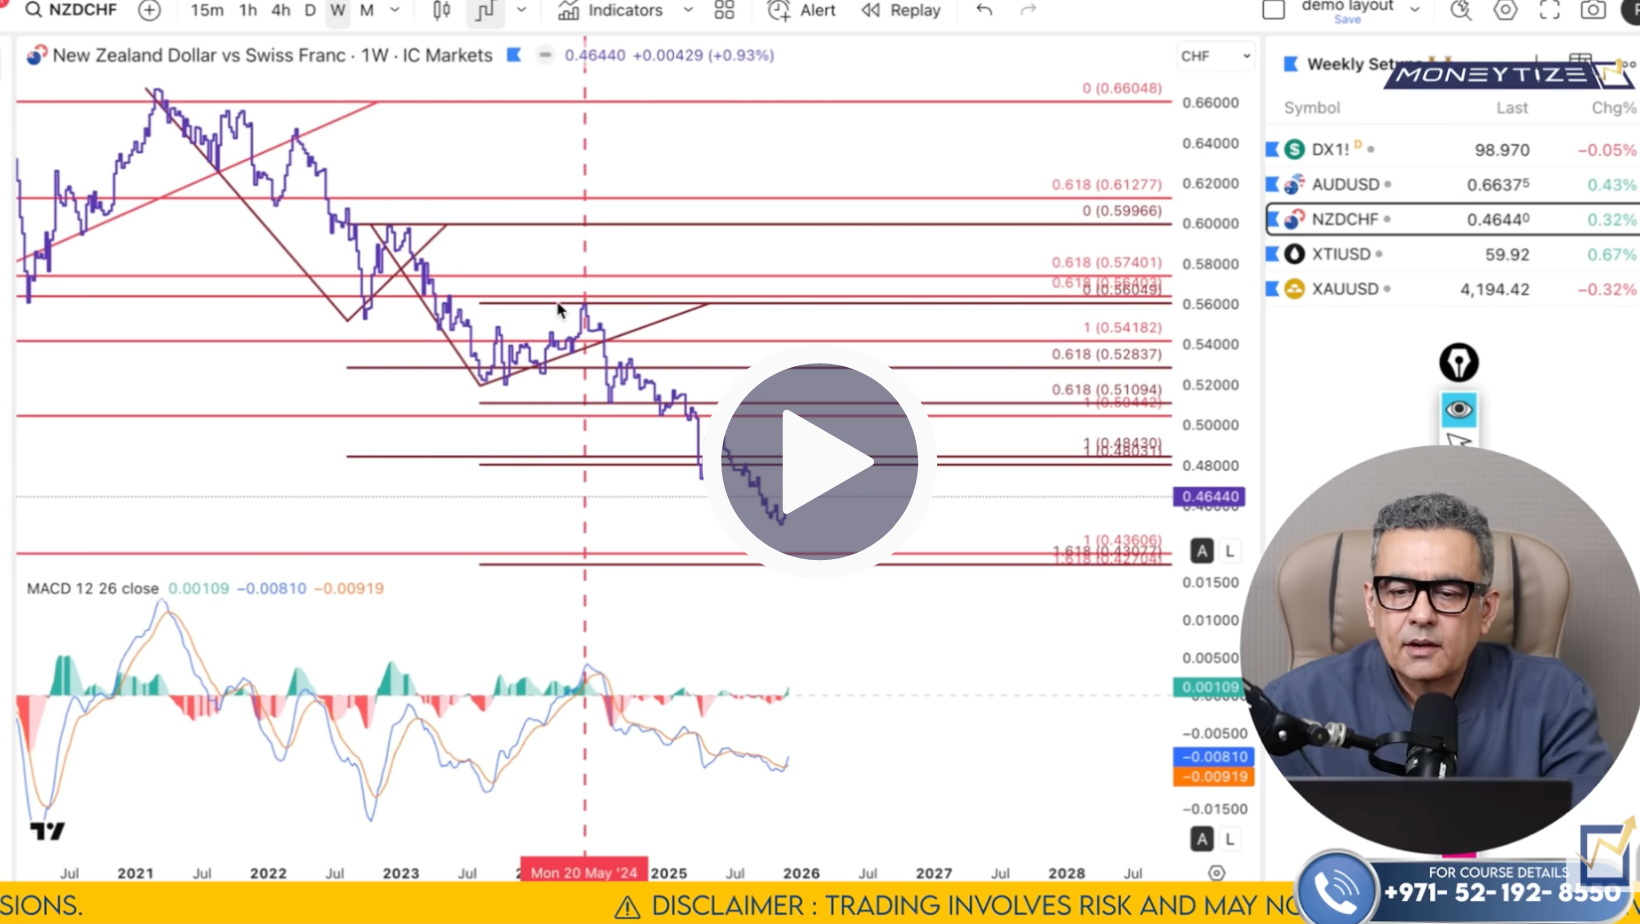
NZD/CHF (New Zealand Dollar vs. Swiss Franc)
NZD/CHF has been under long‑term pressure, but we may be seeing a reversal building. On monthly and weekly timeframes, bearish momentum seems to be fading, and bullish divergence appears to be forming. On the daily chart, a structure‑break has already occurred, suggesting the pair could be setting up for a fresh rally.
Nikkhil sees potential for a 300 - 400 pip move if bullish momentum continues. Key buy zones could form around 0.4545, maybe as low as 0.4516 (stop‑loss below 0.4496). First targets: 0.4800 - 0.4843. Final longer‑term aim: 0.5050 (psychological + extension zone).
Crude Oil (WTI / Brent, commodity complex)
Crude has built a solid long-term base. On monthly charts there’s a double bottom forming; on weekly charts similar bottoming and compressed bearish momentum is visible. On the daily chart the retracement bottomed out near a 61.8% Fibonacci level, and now oil looks set to rise.
If price holds above 57.46, Nikkhil’s watching for a move to 60.85, which would open up 62.7, 65.8, and potentially 67.5 as medium‑term targets. On the 4‑hour chart the structure supports continuation if 59.70 holds. But a drop below 57.50 would weaken the bullish thesis.

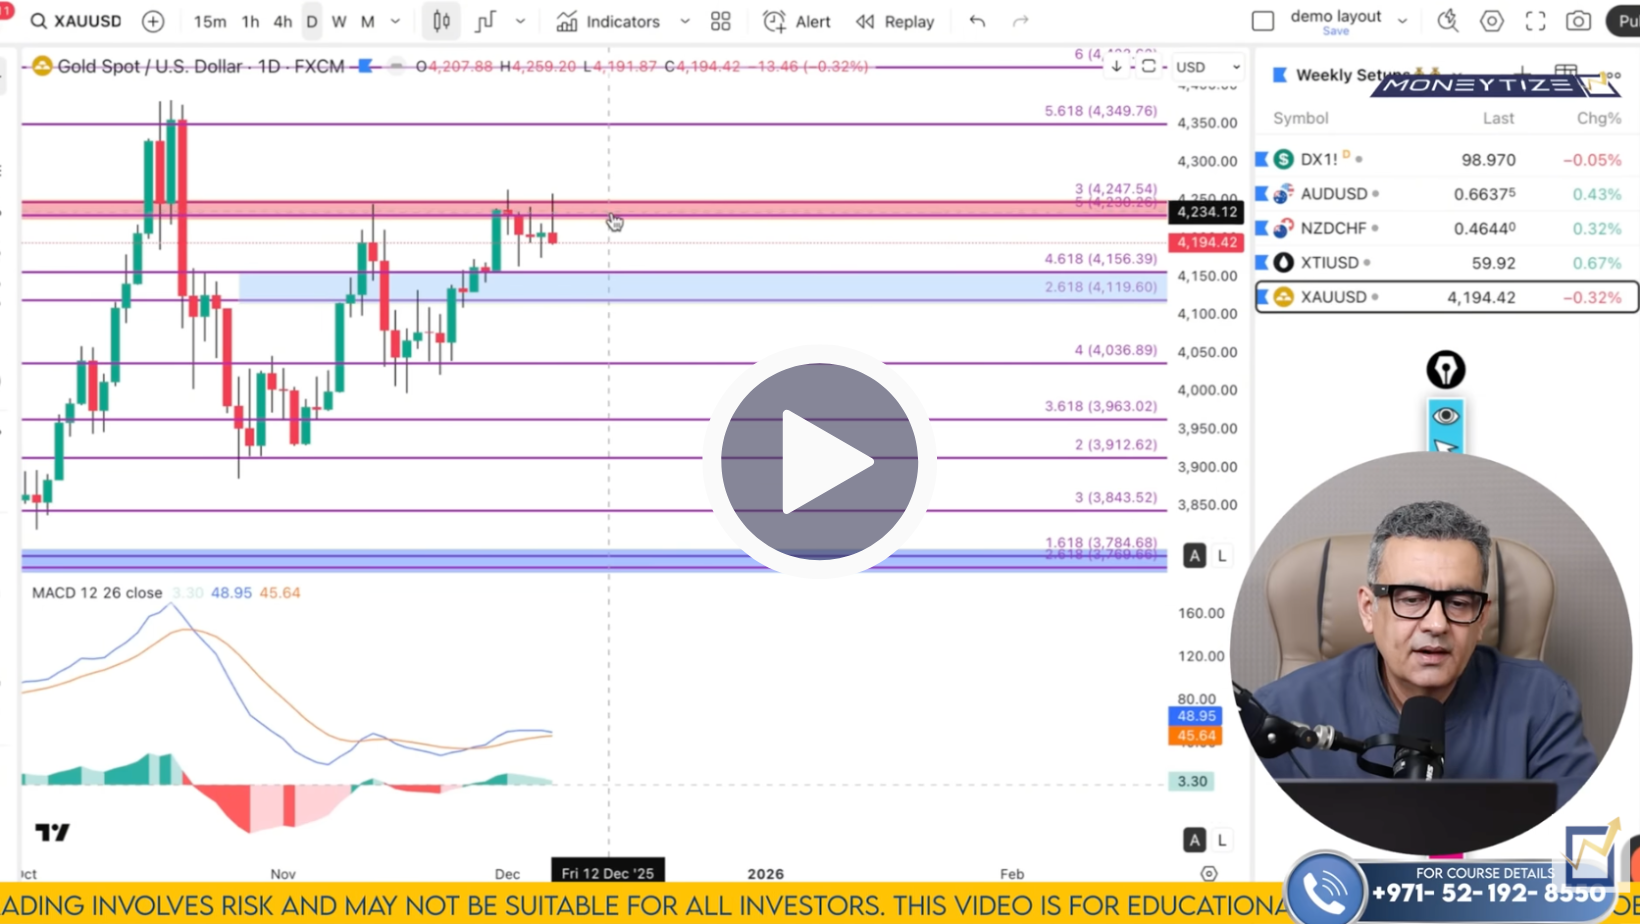
Gold (XAU/USD)
Over the monthly and weekly charts, gold remains in a steady long‑term uptrend, with higher‑highs and no bearish divergence in sight. On the daily and lower timeframes, price action confirms bullish structure, and given expected dollar weakness if the Fed cuts, gold is positioned well for a rally.
Immediate resistance lies around 4,230 - 4,247. A clean close above here could take gold to 4,265, then 4,295, and if momentum holds, potentially up to 4,350 or even 4,357. If price instead dips, support zones are down in the 4,173 - 4,190 range, and in a deep retracement possibly 4,050 - 4,030. Unless daily closes fall below 4,050, Nikkhil remains bullish toward 4,300 - 4,350.
This week’s central‑bank calendar could shake things up, and the volatility may trigger false moves or liquidity‑hungry spikes.
That’s why preparation and patience matter more than ever.
Regardless of the noise, the technical zones Nikkhil outlined remain valid.
Price will react to policy, but structural setups don’t vanish because of a headline.
Click here to watch the full Moneytize Forecast
Stay sharp, trade smart, see you next week.
We’ll talk soon
Team Moneytize