

Welcome back to our new weekly forecast for the trading week starting December 15th. Volatility is coming and this time, it’s a global wave. With major rate decisions lined up from the ECB, Bank of England, and Bank of Japan, along with U.S. inflation data and the Non-Farm Payrolls report, the markets are primed for sharp moves, possible fakeouts, and big structural shifts. As a trader, this isn’t the week to chase, it’s the week to be positioned, but prepared. Expect sharp reactions, but wait for confirmation. That’s exactly the kind of disciplined approach Nikkhil walks you through in today’s breakdown. From a coiling gold market near all-time highs… to a weakening U.S. Dollar and corrective setups on Nasdaq, EUR/USD, Silver, and CAD/JPY, every instrument is mapped with clear wave counts, retracement zones, and key levels that matter.
Let’s dive in.
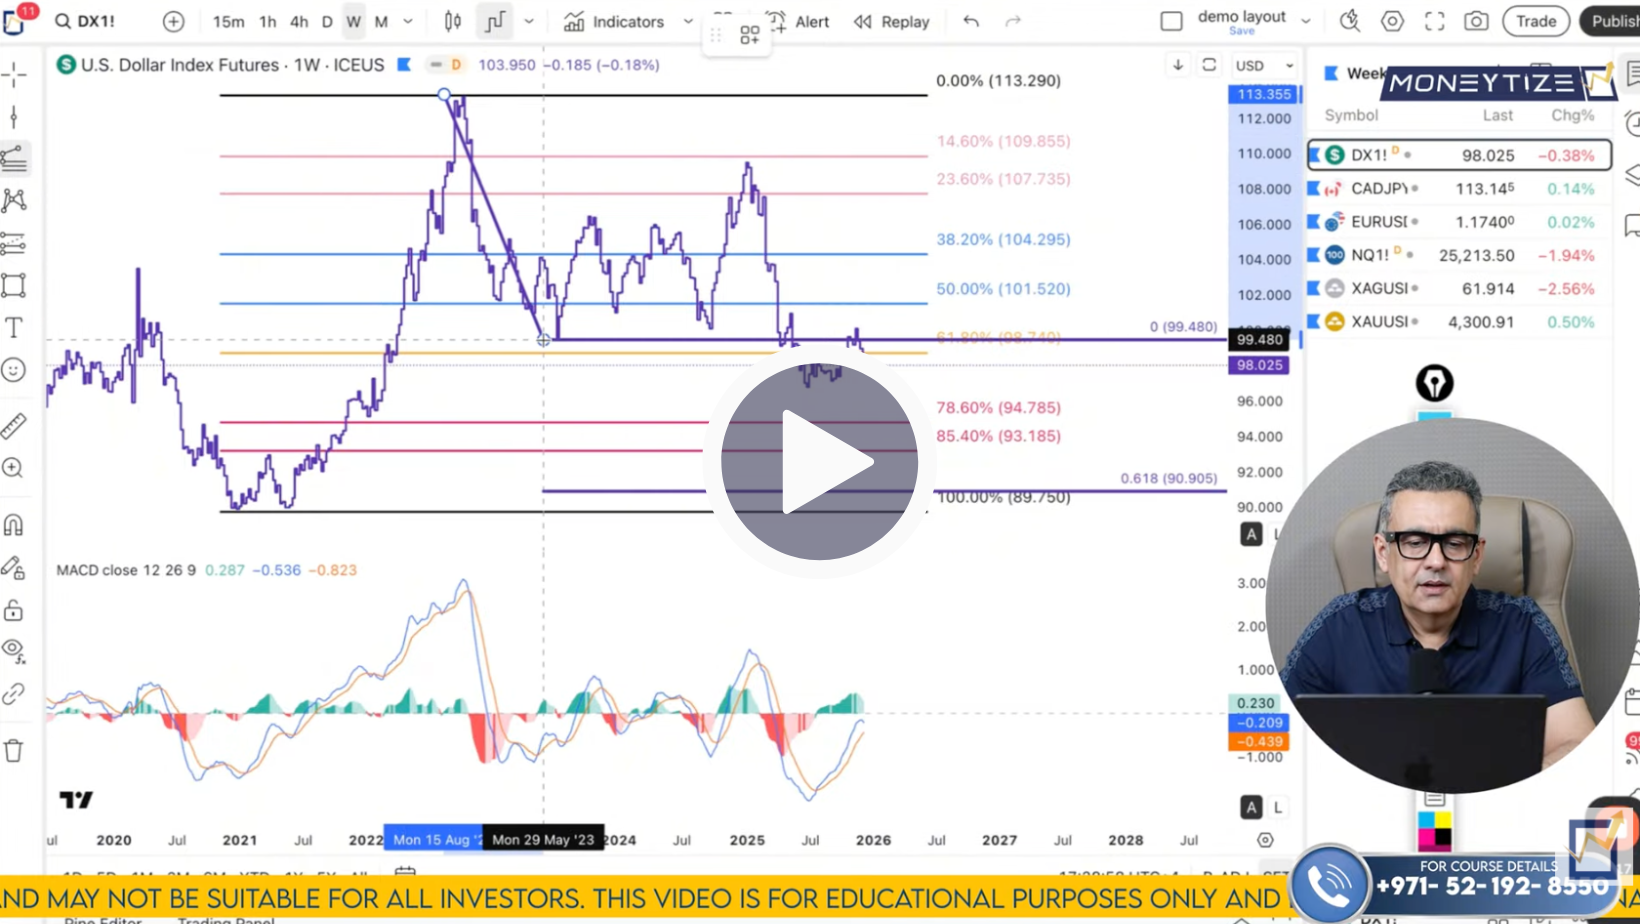
DXY (U.S. Dollar Index)
Let’s start with the Dollar Index because its structure is telling the story for many other pairs. On the weekly timeframe, we can see a clear bearish trend: a strong push down, a corrective bounce, then continuation lower. Sellers have taken control, and on the daily chart that bearish momentum is confirmed with a break of structure and no bullish divergence. When structure breaks like this, it often signals that the trend will keep stretching before the next meaningful pullback. On the 4‑hour timeframe, the downtrend is intact with lower lows and no bullish signs. The closest resistance you need to keep in mind is around 99.22 - any bounce toward that level becomes a tactical selling opportunity in the context of the larger downtrend. Meanwhile, on the 1‑hour timeframe, market structure is continuing lower, and short‑term rises from data releases should be treated as sell on rally opportunities, not fresh buys.
So the plan here is simple: bearish bias on DXY remains dominant - sell strength toward resistance zones and let the trend work in your favor.
CAD/JPY
CAD/JPY continues to show a bullish bias on higher timeframes, but it’s not a straight shot upward. On the weekly chart, buyers stepped in strongly and extensions suggest magnet zones north of current price levels around 116.95 - 117.26. This gives us a structural target to work toward.
On the daily chart, the sequence of pushes higher keeps the long bias valid, though we are seeing exhaustion signs on shorter timeframes. On the 4‑hour chart, buyers have hit the 161.8 extension and paused, which gives us a chance to look for pullbacks as buy‑the‑dip opportunities.
On the 1‑hour chart, there’s a double top and rising trendline that could break first. If the trendline breaks and we get a retest lower, that becomes a high‑probability buy zone toward continuation. Key support rests near the 78.6 - 85.4% retracement zone, while a break below 112.52 opens the next leg down before the eventual push north.

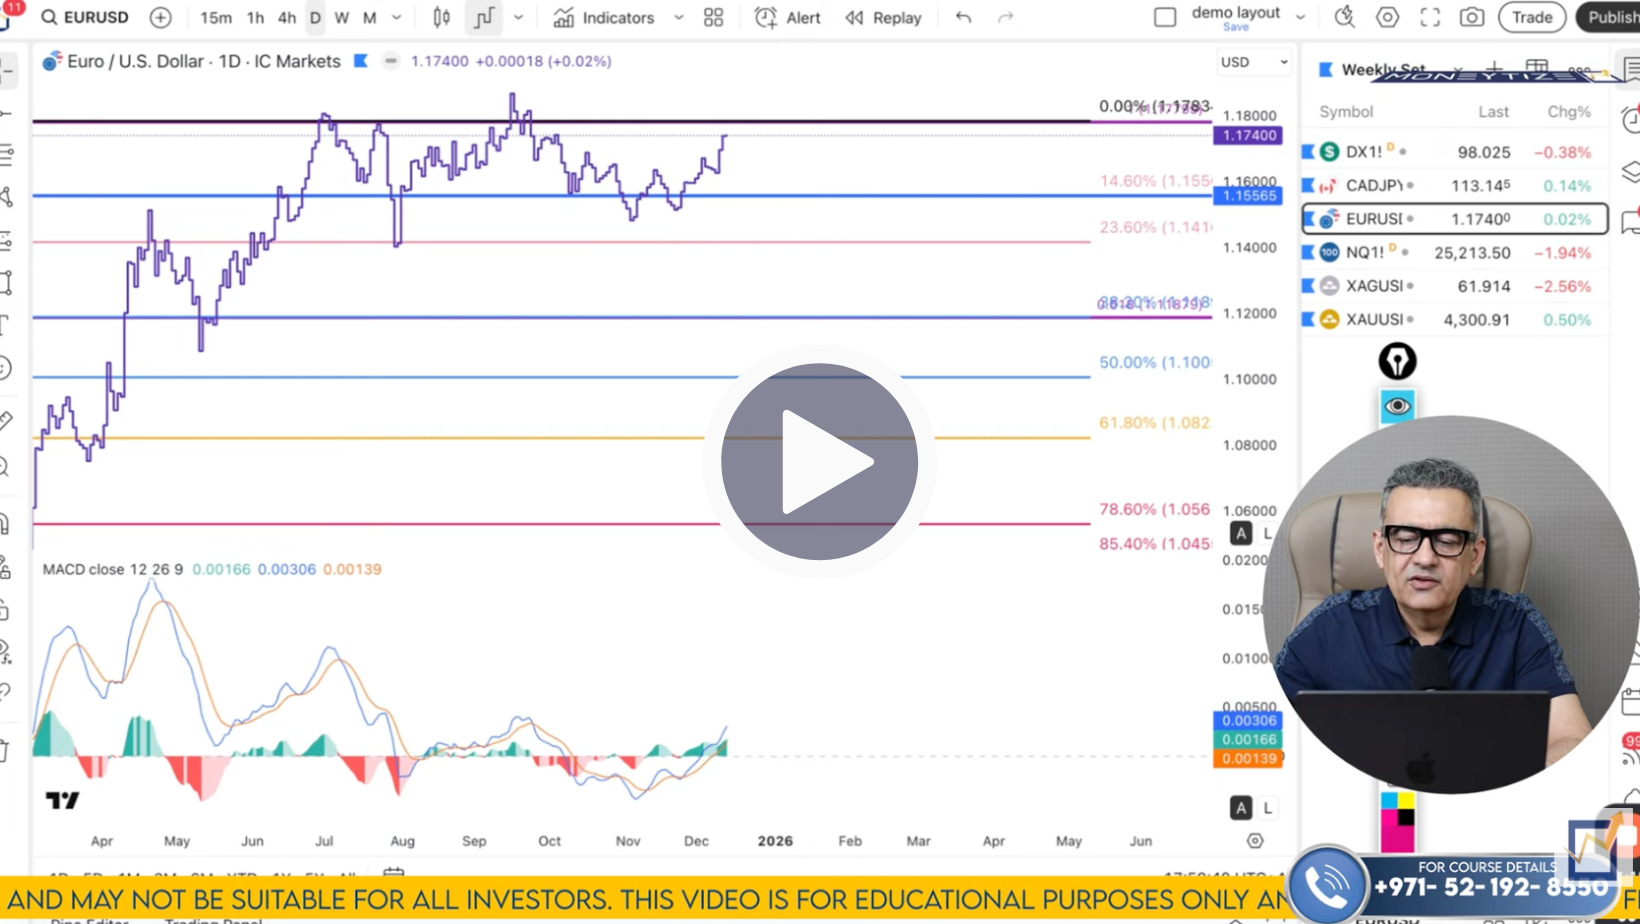
EUR/USD
EUR/USD is structurally supported by the bearish Dollar Index theme, meaning euro strength should remain intact. On the weekly chart, extensions point to higher targets, though we needed to drop down to the daily timeframe to confirm the break of structure. Once that level broke, momentum shifted bullish.
From the daily frame, we have a clear extension project higher into the 1.1765 - 1.1780 zone with even more upside above that toward 1.1826 if key resistance levels flip into support. On the 4‑hour chart, the pair is approaching resistance magnet zones, and lower‑timeframe bearish divergence suggests a pullback is likely first.
But crucially, pullbacks are your opportunity to buy - the trend remains bullish unless price breaks below 1.1650. If we get a drop to 50% retracement near 1.1690, that becomes a tactical entry zone with defined targets up the sequence.
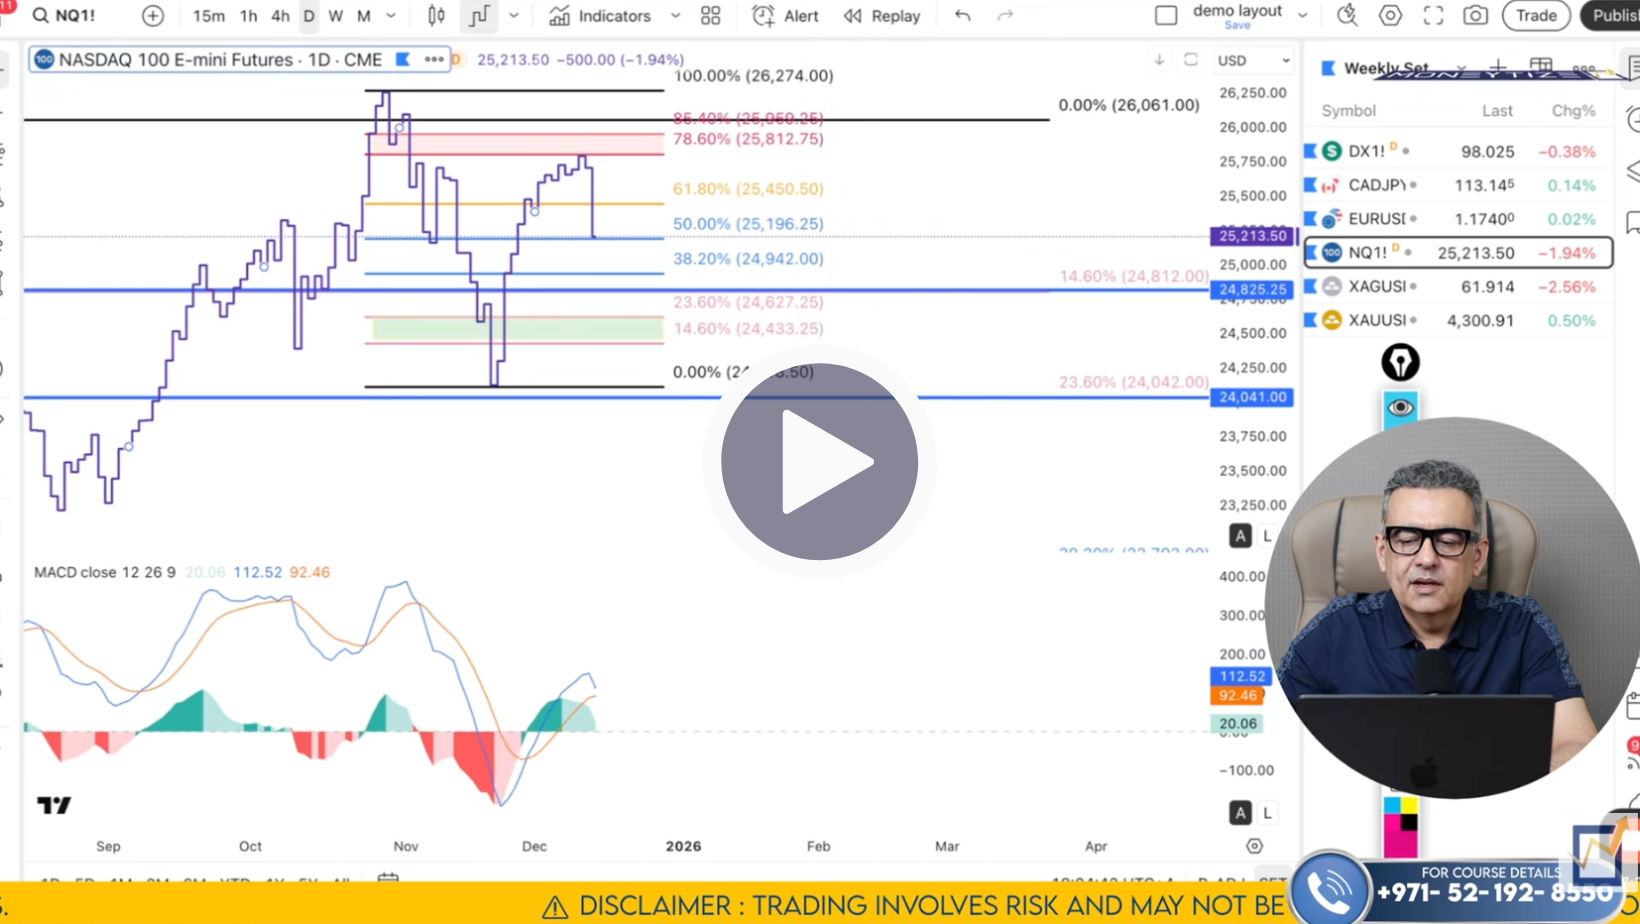
Nasdaq (NDX)
Nasdaq has shown short‑term weakness from resistance and, on the weekly frame, support around 24,000 - 24,942 could be tested if downside pressure persists. On the daily chart, corrective bounces have met resistance and price is poised to revisit lower support levels before any resume of the broader uptrend.
On the 4‑hour timeframe, pressure remains bearish and the next obvious support is in the 24,825 area, with deeper support down toward 24,433. Unless and until support holds, buying here makes less sense - patience will be rewarded when price reaches a true structural support zone.
On the 1‑hour chart, momentum favors the downside, and any short‑term rallies should be taken as chances to sell into resistance or simply wait for support to buy.
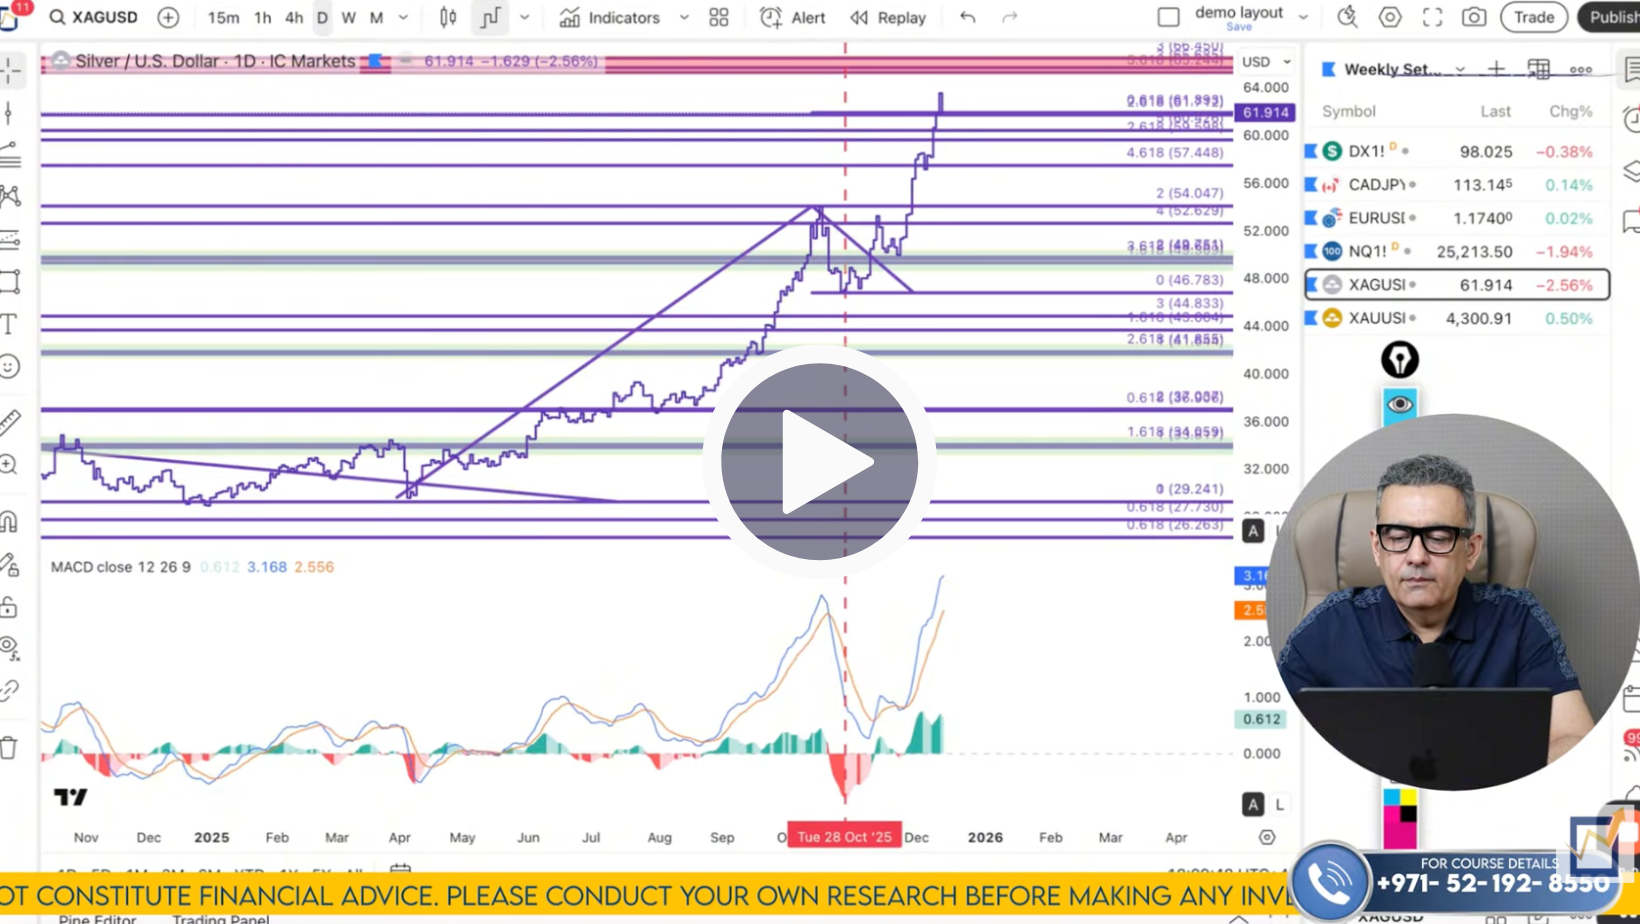
Silver (XAG/USD)
Silver continues to show bullish structure on weekly and daily timeframes, but short‑term corrective moves are playing out now and give us our best entries. On the weekly frame, price continues higher with successive bullish extensions. On the daily chart, structure remains intact and silver is still making higher highs.
Shorter‑term charts like the 4‑hour and 1‑hour show bearish divergence and pullback setups, suggesting that consolidation is underway before the next leg up. The key support range Nikkhil’s watching is 57.84 - 58.36, this is where he wants to be building long positions ahead of continuation. The nearest resistance is in the 62.5 - 63.27 area, and if price moves above that on strong conviction, the next targets expand into the 65+ zone.
So the plan for silver: accumulate on correction, hold for the next upward extension. Correction isn’t reversal, it’s your tactical entry zone.
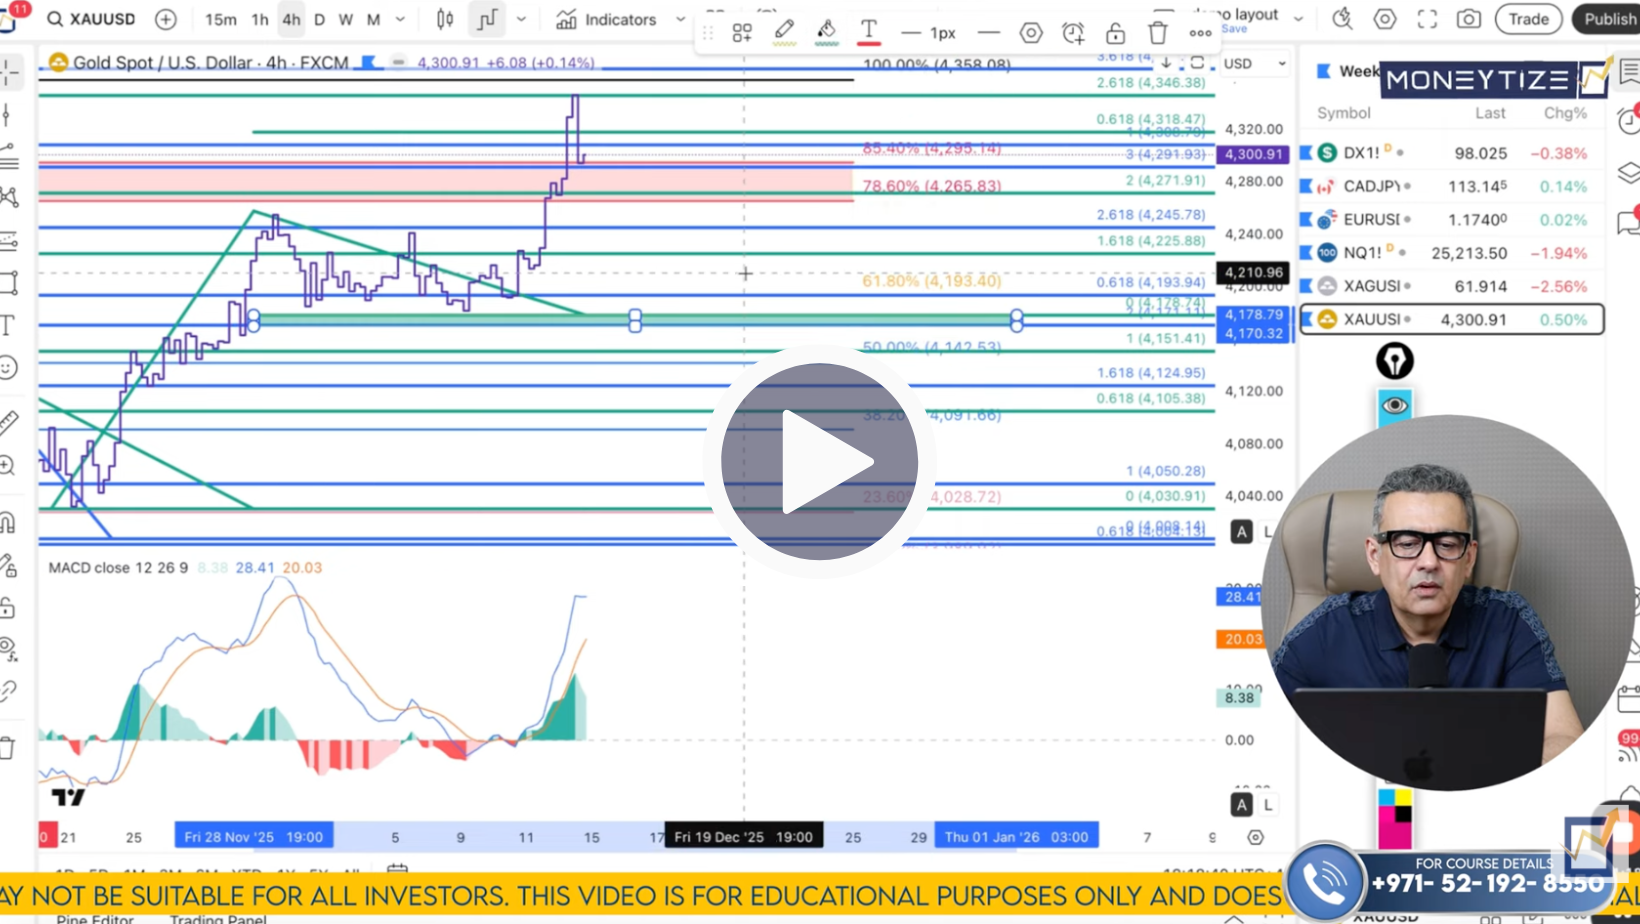
Gold (XAU/USD)
Gold remains one of the cleanest bullish structures we’ve seen. On the weekly timeframe, the trend is strongly upward with higher Lows and rising MACD momentum. On the daily timeframe, price closed the week above critical retracement zones - signaling buyer strength.
On the 4‑hour chart, multiple bullish extensions project higher targets, with structure pointing toward new all‑time highs if key resistances break. For now, the immediate pullback or consolidation should be taken as opportunities to accumulate - the major support zone lies between 4205 - 4217. Once that area holds, the next upside magnets are 4355, 4395 - 4404, 4412, and ultimately $4,500.
On the 1‑hour and 15‑minute charts, we see short‑term bearish divergence, meaning a small pullback is likely. But this pullback gives us the best chance to build long exposure ahead of continuation.
We’ve got major rate decisions, key U.S. data, and structural setups across almost every market this week. That means real opportunity, but only if you have a clear plan and disciplined entry zones.
Click here to watch the full Moneytize Forecast
We’ll talk soon
Team Moneytize