
.jpeg)
Welcome to this week’s forecast for the trading week beginning 1 December. We’ve just seen Gold break out of consolidation as expected, but the big question now is: will that breakout hold, or is it a trap for retail traders? This week, Nikkhil is taking a close look at key pairs and indices - Nasdaq Composite (NAS100), Silver (XAGUSD), GBP/USD, USD/JPY, and the U.S. Dollar Index (DXY) to map what could unfold.
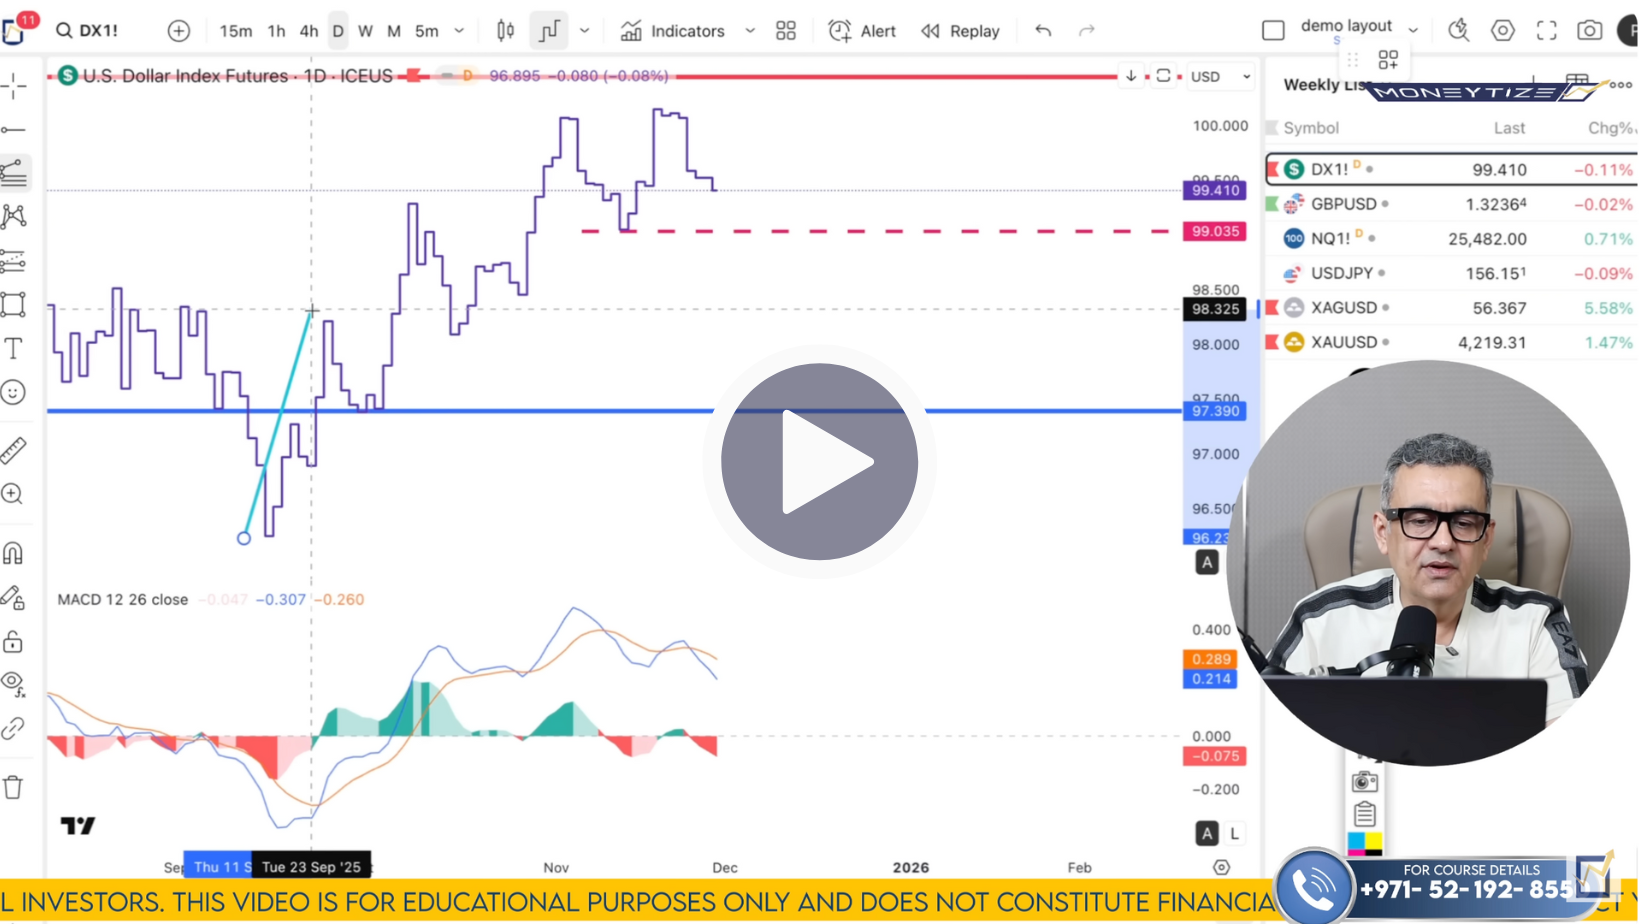
DXY (U.S. Dollar Index)
The Dollar Index remains perhaps the most important macro “compass.” By measuring the U.S. dollar against a basket of major currencies, DXY gives a sense of dollar strength or weakness in one glance. Right now, DXY is showing signs of fatigue. On higher‑timeframe charts, bullish momentum seems to be fading, while lower‑timeframes are hinting at bearish divergence and a possible corrective move. If price drops below a key support zone around 99.03, sellers could re‑assume control, opening the door to a deeper pullback. However, as long as price remains above that level, a bounce toward 100.62 - 100.71 remains possible.
This matters for the entire market: a weakening dollar tends to boost commodities and risk assets - especially gold, silver, and stock indices, because DXY often moves inversely to those instruments.
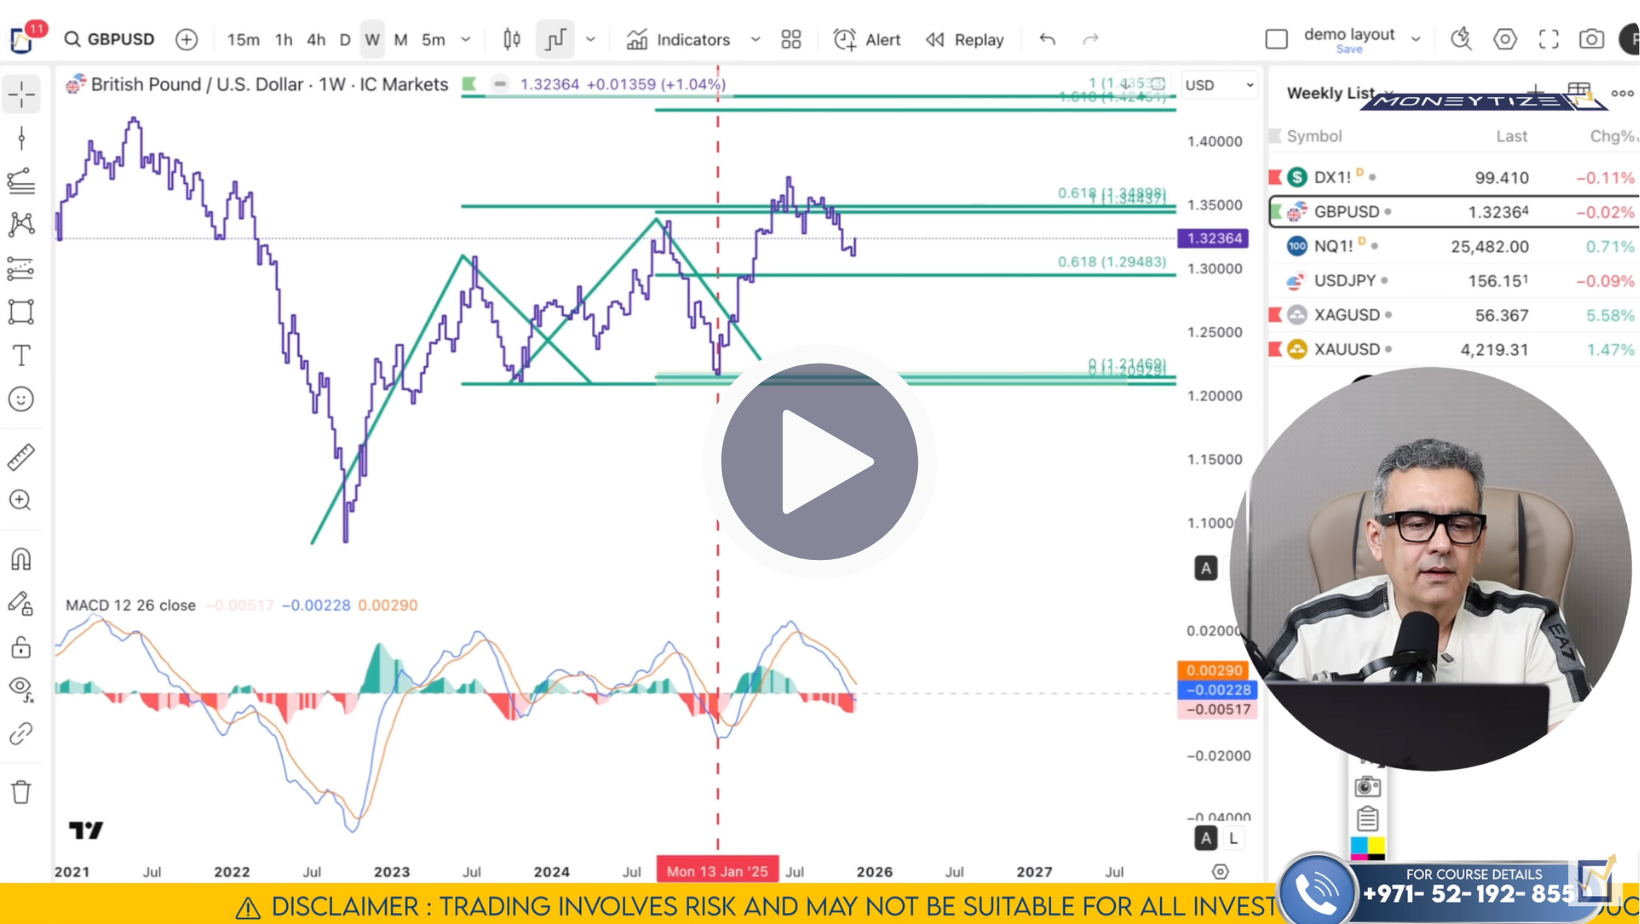
GBP/USD
With the dollar showing weakness, GBP/USD looks well‑positioned for upside. On the monthly frame, the pair is still in an uptrend - higher highs and higher lows remain intact. On the weekly and daily frames, recent retracements ended near 38.2% fib levels, and bullish momentum is re‑building as momentum indicators turn positive again.
On the 4‑hour frame, buyers pushed the price to the 100% fib extension ( 1.3239). If bulls maintain control, the next move could target 1.3360 - 1.3435. A short‑term pullback toward 1.3165 - 1.3170 (or maybe 1.3110) could offer an attractive entry point for longs.
Nasdaq (US Stock Market)
Weakness in the dollar has helped fuel a rebound in equities, and that appears to be the case for the Nasdaq too. On the weekly chart, the index had pulled back after a run‑up. On the daily chart, the recent drop found support at the 23.6% fib level - around 24,000 - and price has since staged a sharp “V‑shaped” recovery, now trading higher near 25,482. That points to strength.
On the 4‑hour chart, buyers broke a falling trend line and recaptured the 100% fib extension from the most recent dip - bullish signs. Momentum is building, and our next target zone is 25,761 - 25,800. A deeper pullback toward 25,132 could be a good entry point, but if we see a daily close below 25,000, that would invalidate the short‑term bullish scenario.

USD/JPY
USD/JPY remains in a long‑term bullish trend on monthly and weekly frames. From the monthly low up toward the resistance magnet zone around 176.5 - 180, the bias is clearly up. On the weekly chart, price has recently entered a resistance zone around 156, where bearish divergence is visible, suggesting a possible short‑term pullback before continuation.
On the daily frame, as long as price stays above support near 154.82 - 154.90, we expect buyers to support a move toward 159 - 160. On the 4‑hour chart we may see a corrective retracement first, and then continuation higher, but because of daily‑timeframe divergence, any bounce should be treated with caution, and long entries ideally timed after a clean retest of support.

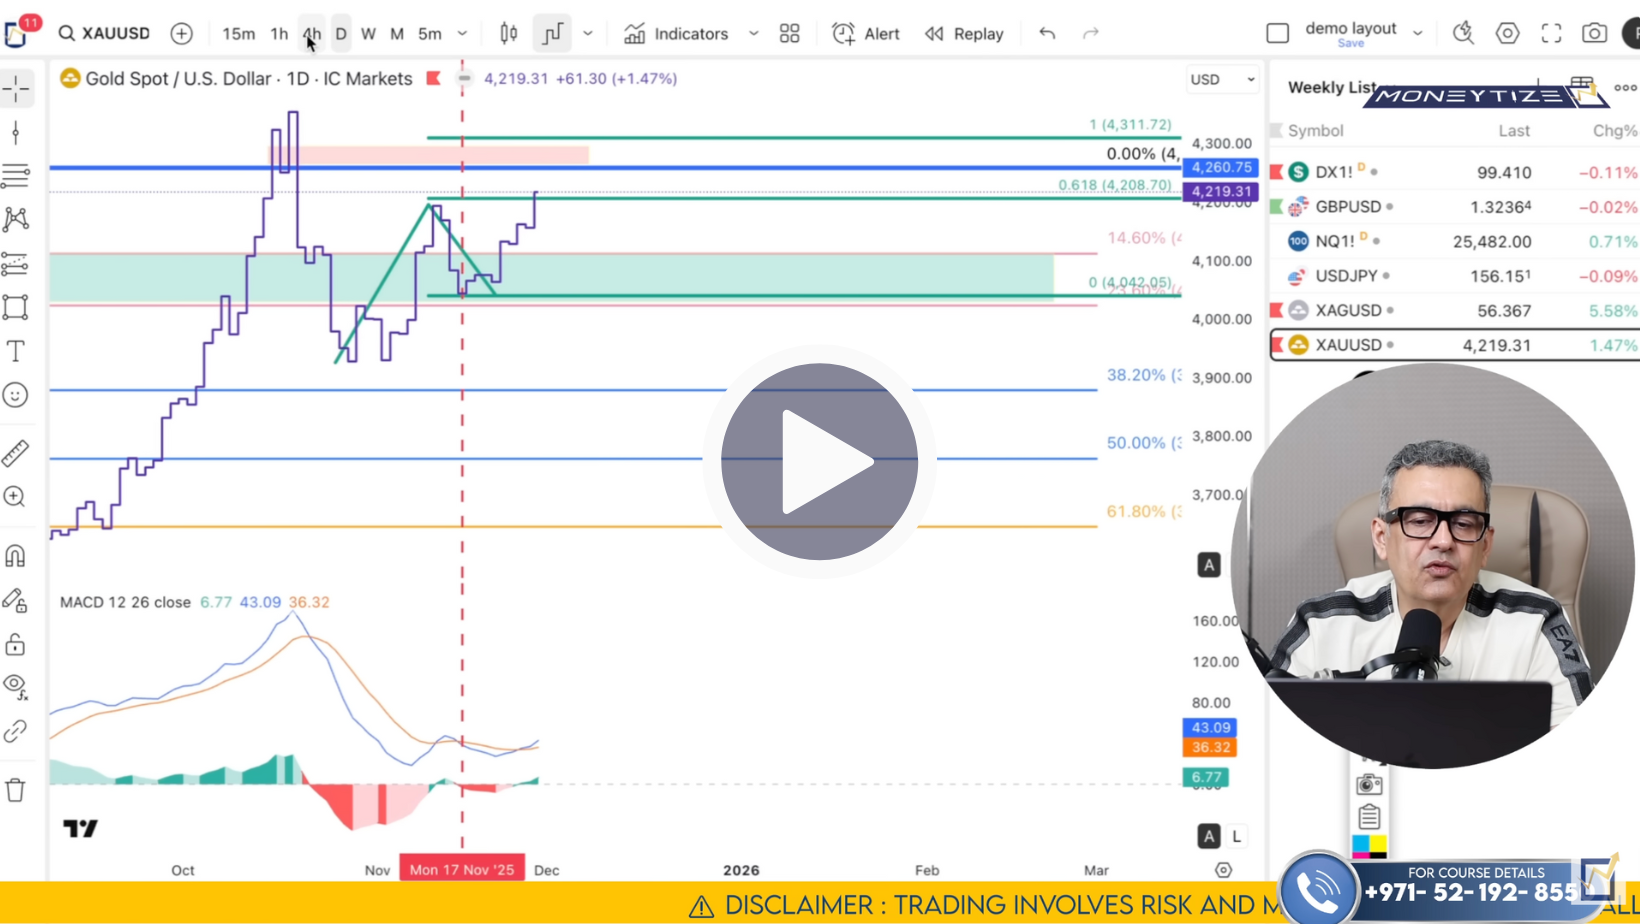
Silver & Gold
With the dollar showing signs of weakening, both silver and gold - priced in USD - stand to benefit. That classic inverse‑correlation between USD and precious metals remains in force.
Silver (XAGUSD): Bullish momentum remains intact. On monthly, weekly, daily, and hourly timeframes, the structure is strong: higher highs, no divergence, and healthy fib‑extension setups. On a drop toward $55.36, $54.92, or deeper toward $53.80 - $54.00, Nikkhil would view that as a buying opportunity - targeting $58.20, then $59.30–$60.00, and eventually $61.00.
The breakout from the triangle consolidation is now confirmed - weekly price closed above support and daily momentum has turned bullish again. On a pullback, support zones near 4,148 - 4,150 or even 4,100 would likely serve as good entry areas.Upside targets remain 4,260 - 4,266 (next resistance zone), then 4,295. And if price breaks above 4,300, the next major upside zone expands toward 4,470 - 4,478
The dollar looks fragile. If DXY breaks below support around 99.03, we could see a broader risk‑on rally across currencies, commodities, and equities.
That could give renewed impulses to GBP/USD, USD/JPY (after pullback), gold, silver, and Nasdaq.
But until we see confirmation, this remains a tactical window, not a free‑pass for indiscriminate buying.
Click here to watch the full Moneytize Forecast
We’ll talk soon
Team Moneytize