

Welcome to this week’s forex forecast starting Monday August 4th.
Against a backdrop of weak U.S. jobs data and renewed trade‑tariff uncertainty, Gold surprised sellers with a sharp bounce off 3, 272 - a hidden support zone that’s now capturing all the attention.
Nikkhil has identified this level and another deeper hidden resistance, mapped across multiple timeframes, and he’s laid out where to watch price next.
Read on to be prepared for key moves ahead, and don’t miss the video to see the exact chart levels and execution plan.
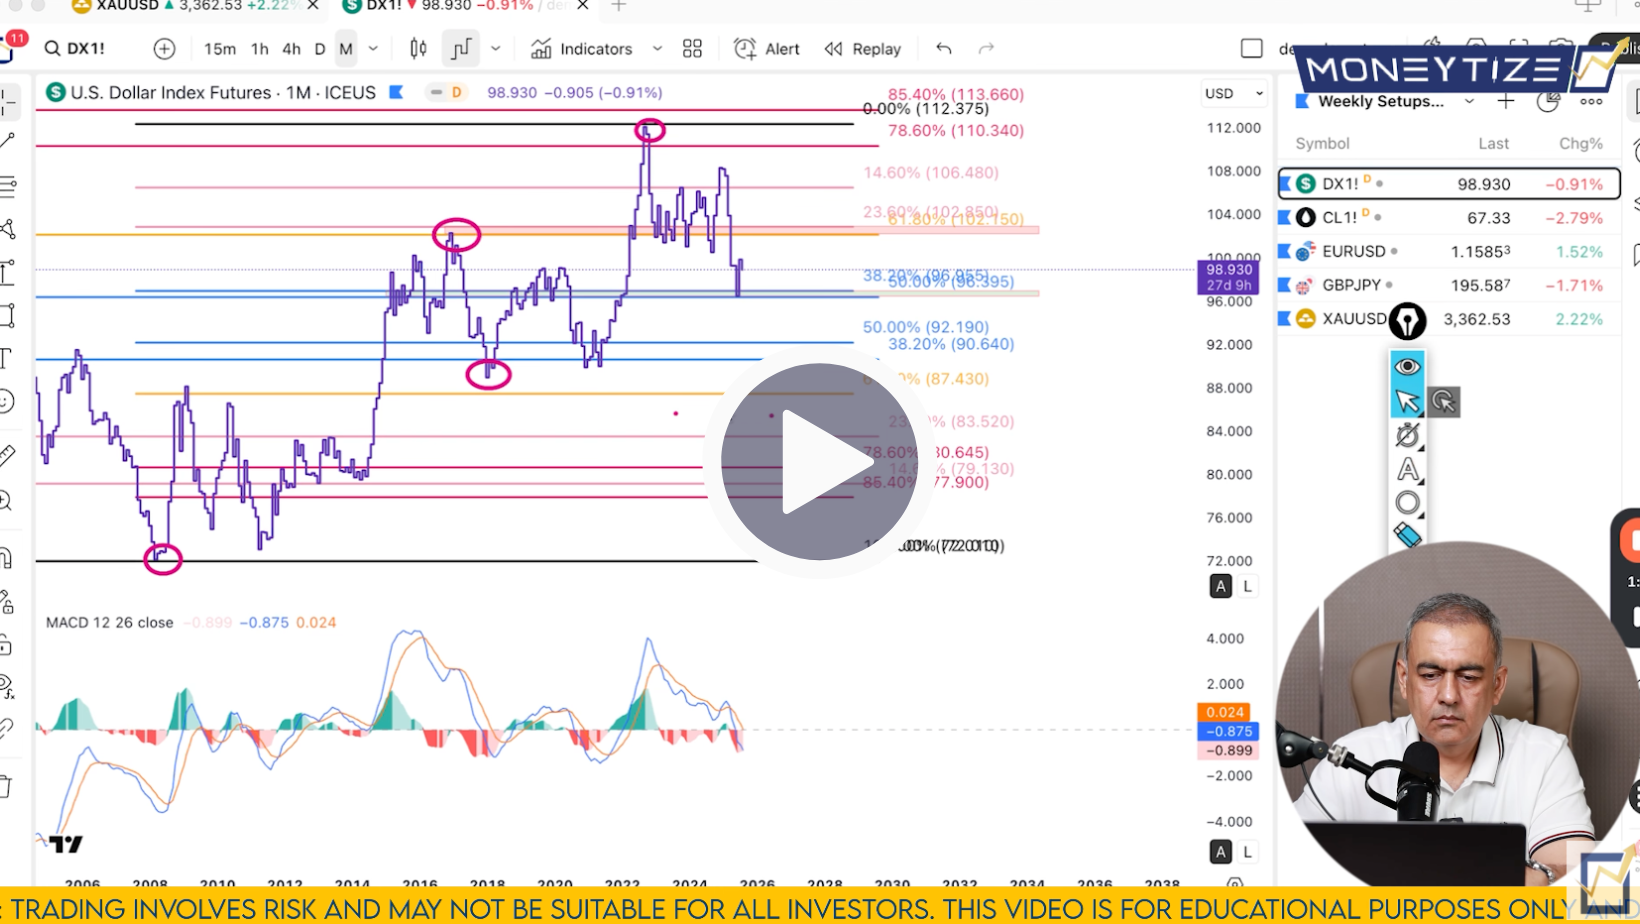
DXY (U.S. Dollar Index):
From the monthly frame, DXY is parked at a major support cluster, with sellers exhausted - the MACD turning light red signals momentum fading. Fib extension levels reinforce a bounce zone around 102.15 - 102.85, with price already reacting. On the weekly chart, bullish divergence confirms buyers stepping in, and a break above 99.76 (the 23.6% Fib) could propel DXY toward the 50% retracement.
On the daily timeframe, lower lows with bullish MACD divergence validate further upside, though a close below the rising trendline would invalidate the bullish thesis. The 4‑hour chart shows buyers pushed past the 100% extension, failed to hold, and have returned to strong support, with the next level at 100.86. As long as the rising trend remains intact, the path is higher, with invalidation below that trendline confirming a bearish turn.
DXY looks ready for a bounce, monitor closely around 99.76 and the rising trendline. If it holds, the next Fibonacci targets may come into play.
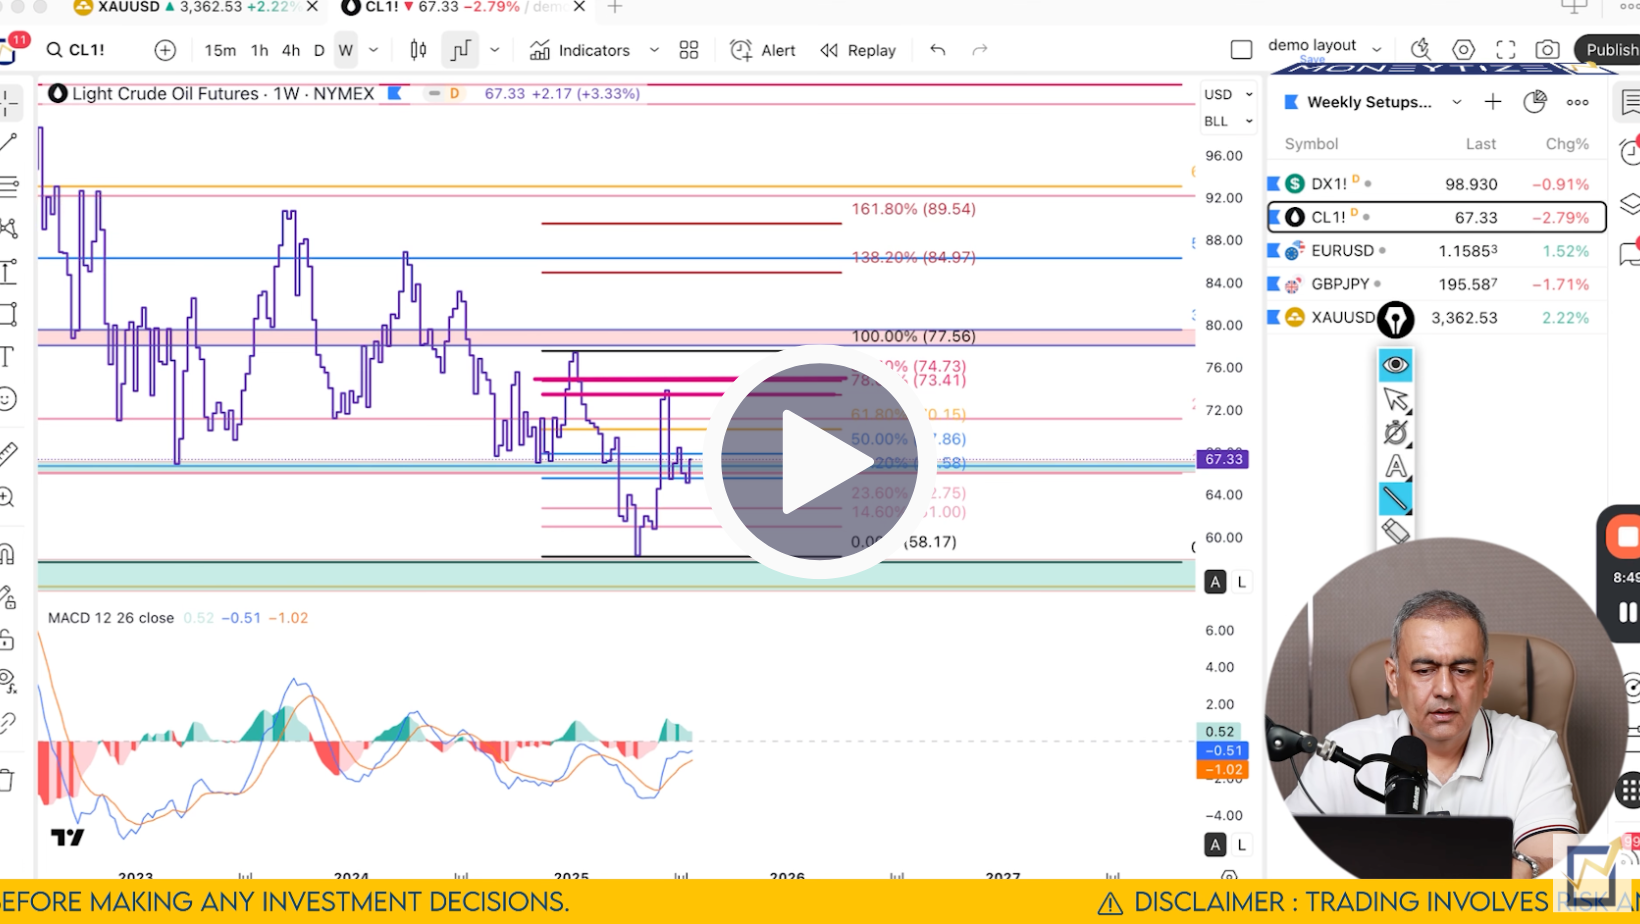
Crude Oil (WTI):
Zoomed out on the monthly, price is nestled in a resistance zone between 78 - 79.5. Sellers appear spent, but no convincing bullish structure yet. Weekly charts show short‑term divergence with no MACD line confirmation, signaling possible bounce followed by downside continuation. The daily chart confirms this with bullish divergence failed and resistance around 14.6 - 23% Fib, placing oil in corrective mode.
A break below 65.43 opens the path toward 60.61 - 59.46, and any bounce toward 71.39 should be sold. On the 4‑hour, price has flipped from bullish to bearish momentum and is facing support at 65. Only if support breaks decisively would Nikkhil consider adding position down to the 60s.
This level could trigger a big reaction.
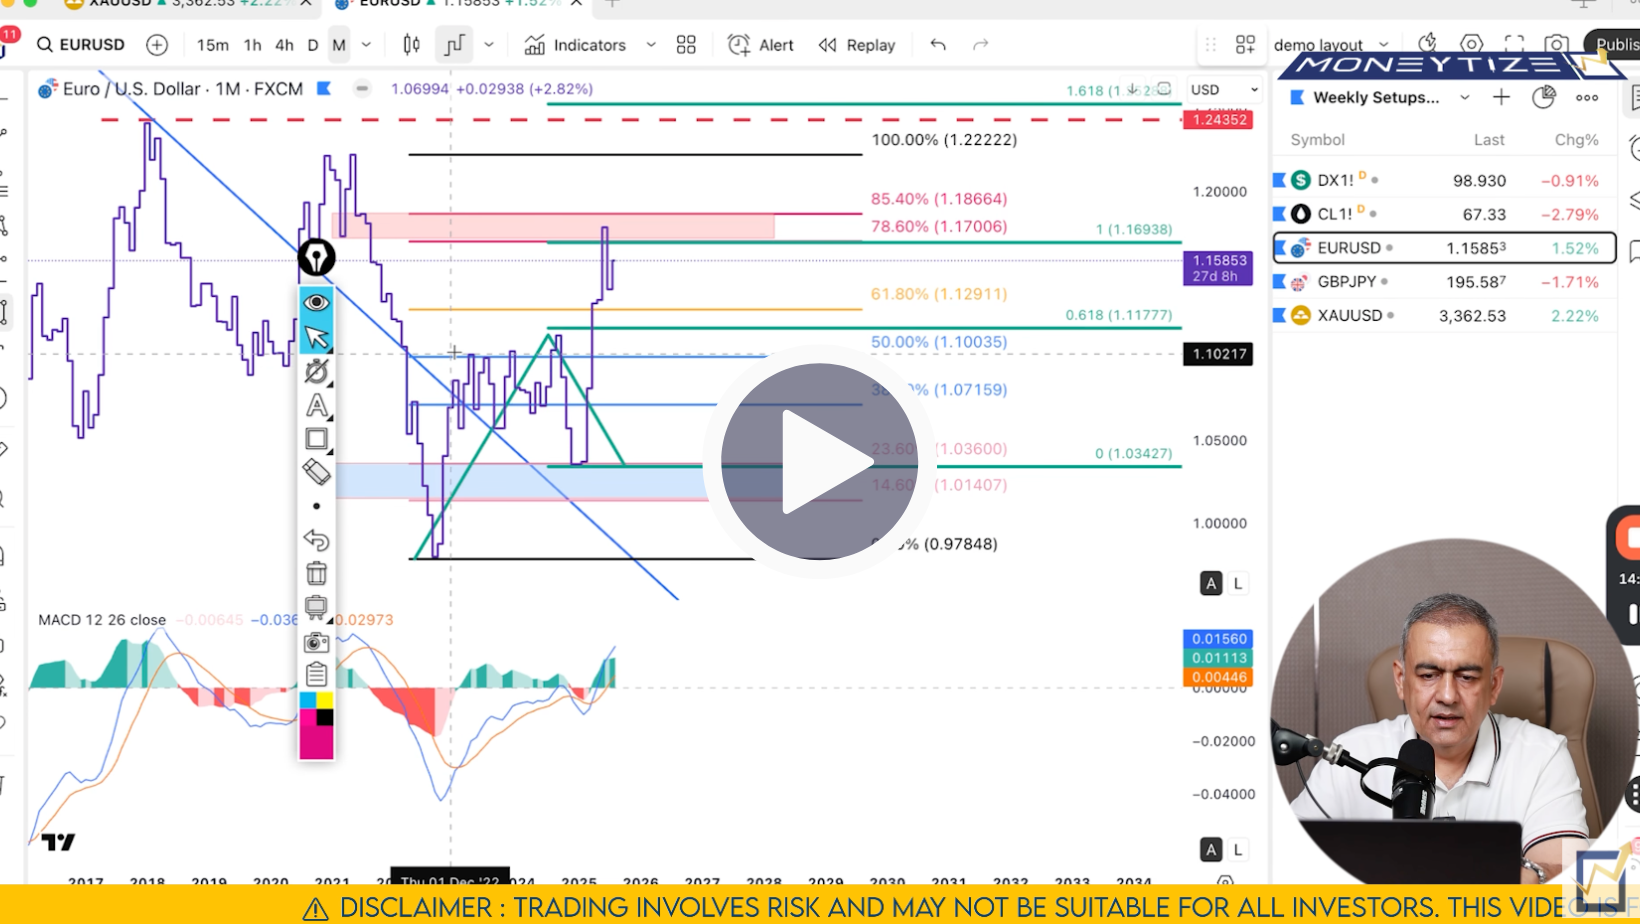
EUR/USD:
From the monthly, buyers have broken the key trendline and price has halted inside the 1.1177 - 1.1291 support zone. The monthly structure remains bullish. On the weekly, momentum has shifted to a corrective pause, implying a possible dip before higher highs resume.
The daily timeframe signals exhaustion through bearish divergence and a compromised rising trendline. Sellers seem to have control for now, and Nikkhil is tracking pullbacks toward 1.1639 - 1.1693 as tactical sell opportunities, aiming down toward 1.1330. Lower‑time supports remain in place, but unless price breaks above 1.1697 - 1.1722, new selling bias remains intact.
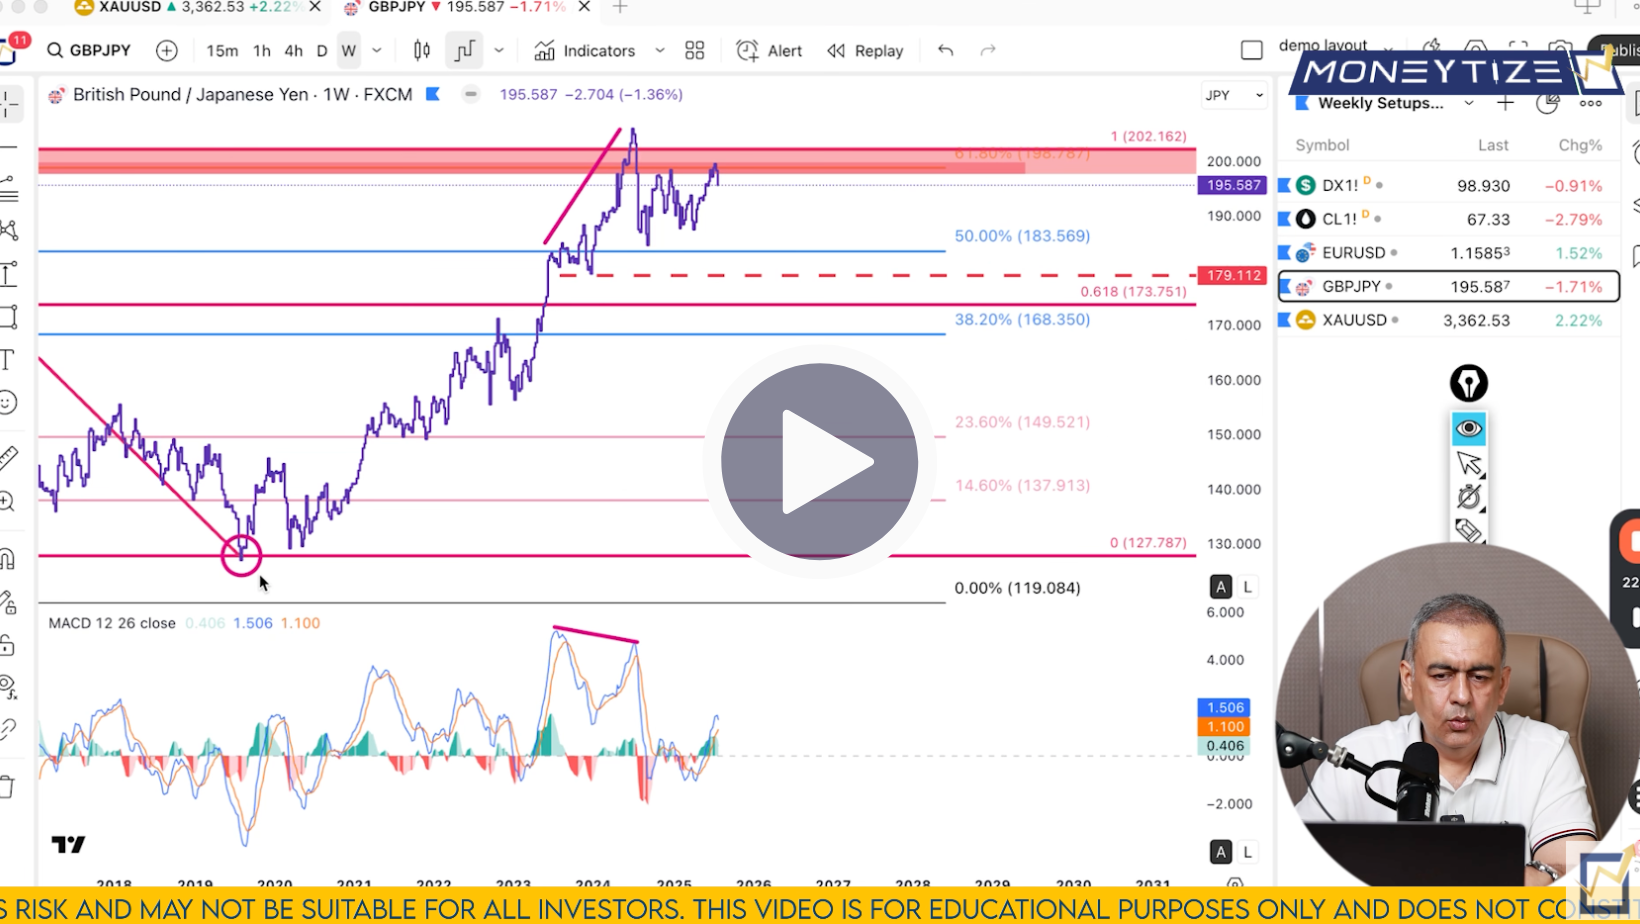
GBP/JPY:
On the weekly, price sits under 61.8% Fib resistance, with bearish divergence on multiple MACD elements. The rising trendline is breached, and retracements suggest resistance in the 187.69 - 189.62 zone with a move toward 23 - 14.6% Fib next.
Daily charts reinforce sellers stepping in near 199, with clear bearish divergence and a trendline break. Nikkhil’s watching for any bounce toward 199 - 195.58 as a sell entry, targeting 194.92 then 192.35 - 193. Keep a close eye on this pair, especially with the upcoming Bank of England rate decision likely to spike volatility.
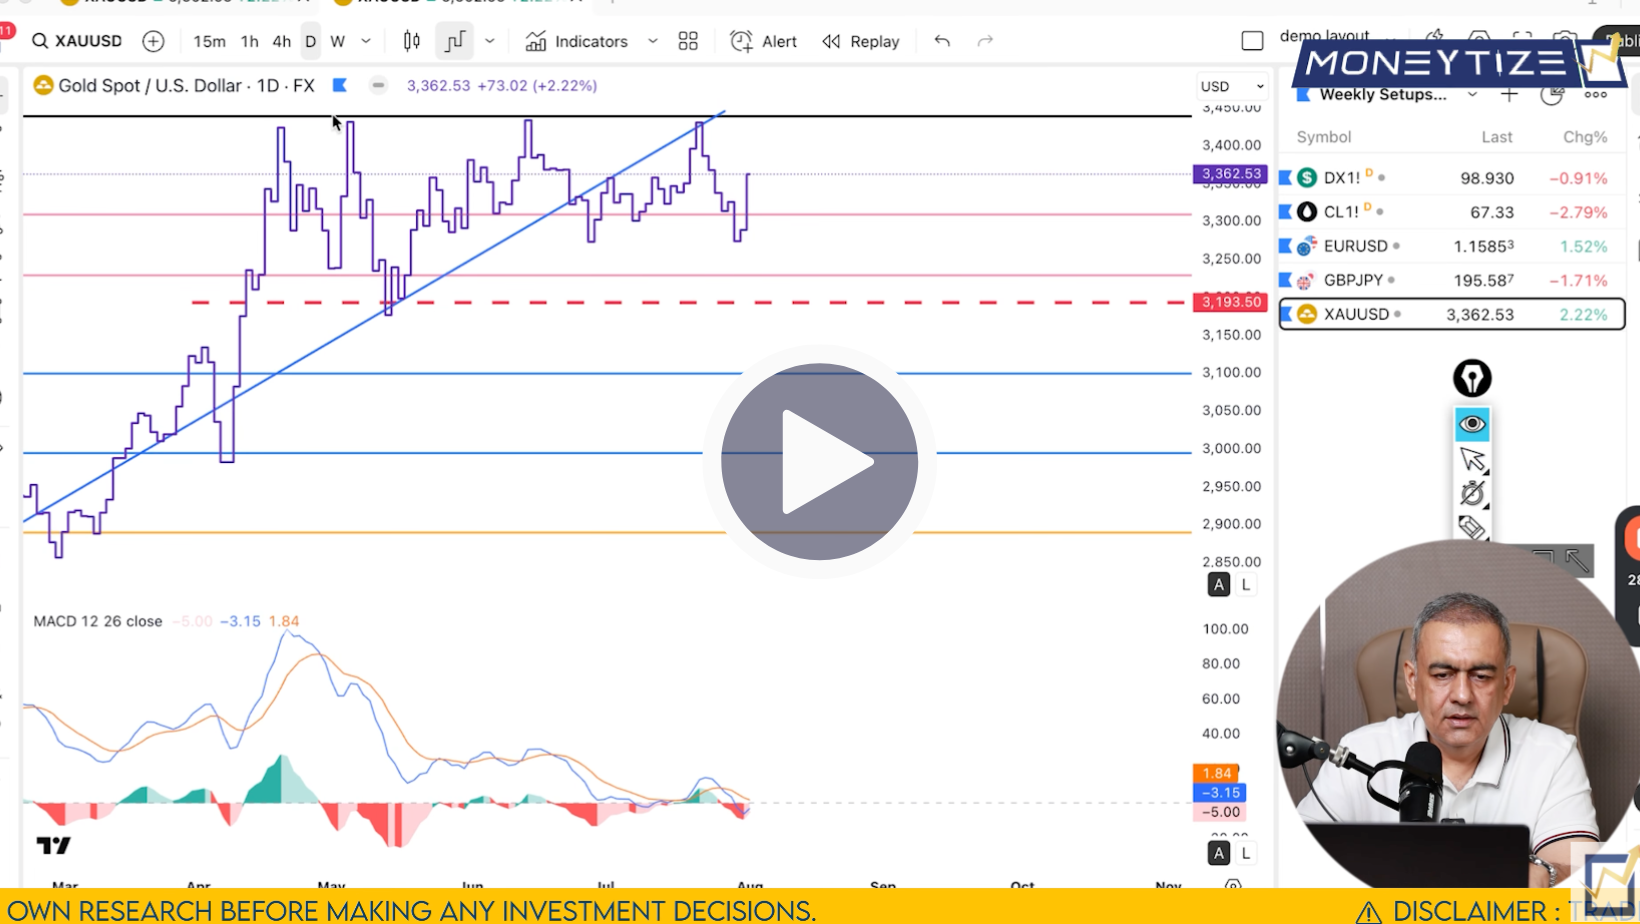
Gold (XAU/USD):
From the monthly, Gold has a strong bullish structure on MACD and histogram readings. Weekly charts show higher highs in price and momentum, but short‑term consolidation or sideways action is possible.
More importantly, on the daily, Gold has bounced off the hidden support at 3,272, marked precisely by the 23.6% retracement. The rising trendline is broken, meaning until price convincingly clears resistance cluster at 3,400 - 3,417, the bias remains bearish. If it holds below that zone, Nikkhil anticipates a move back toward 3,272, then 3,209–3,175. If buyers break and retest above 3,417, only then does he flip to a bullish outlook.
On the 4‑hour, a double bottom and bullish divergence suggest a possible Monday bounce - but likely capped near 3,400 - 3,417, followed by downward continuation. The hourly frame confirms trendline break and gap move upward, with awaited retest. Unless Gold decisively breaks above 3,417, the trading plan is to look for sell entries on rally strength.
Stay prepared this week with clear breakout zones, trendline validations, and divergence signals mapped across key instruments.
Patience and clarity are your advantages.
Watch the full video breakdown to see Nikkhil’s exact charts, trade triggers, and risk plan.
Click Here To Watch The Full Week Forex Forecast
We’ll talk soon
Team Moneytize