

Welcome to this week’s Forex Forecast, where technical clarity meets fundamental direction. Nikkhil led the previous week’s bullish setups precisely, and now he’s back with fresh charts - decoding opportunities in Gold, Crude Oil, the Dollar Index, EUR/NZD, and Ethereum. Let’s dive in.
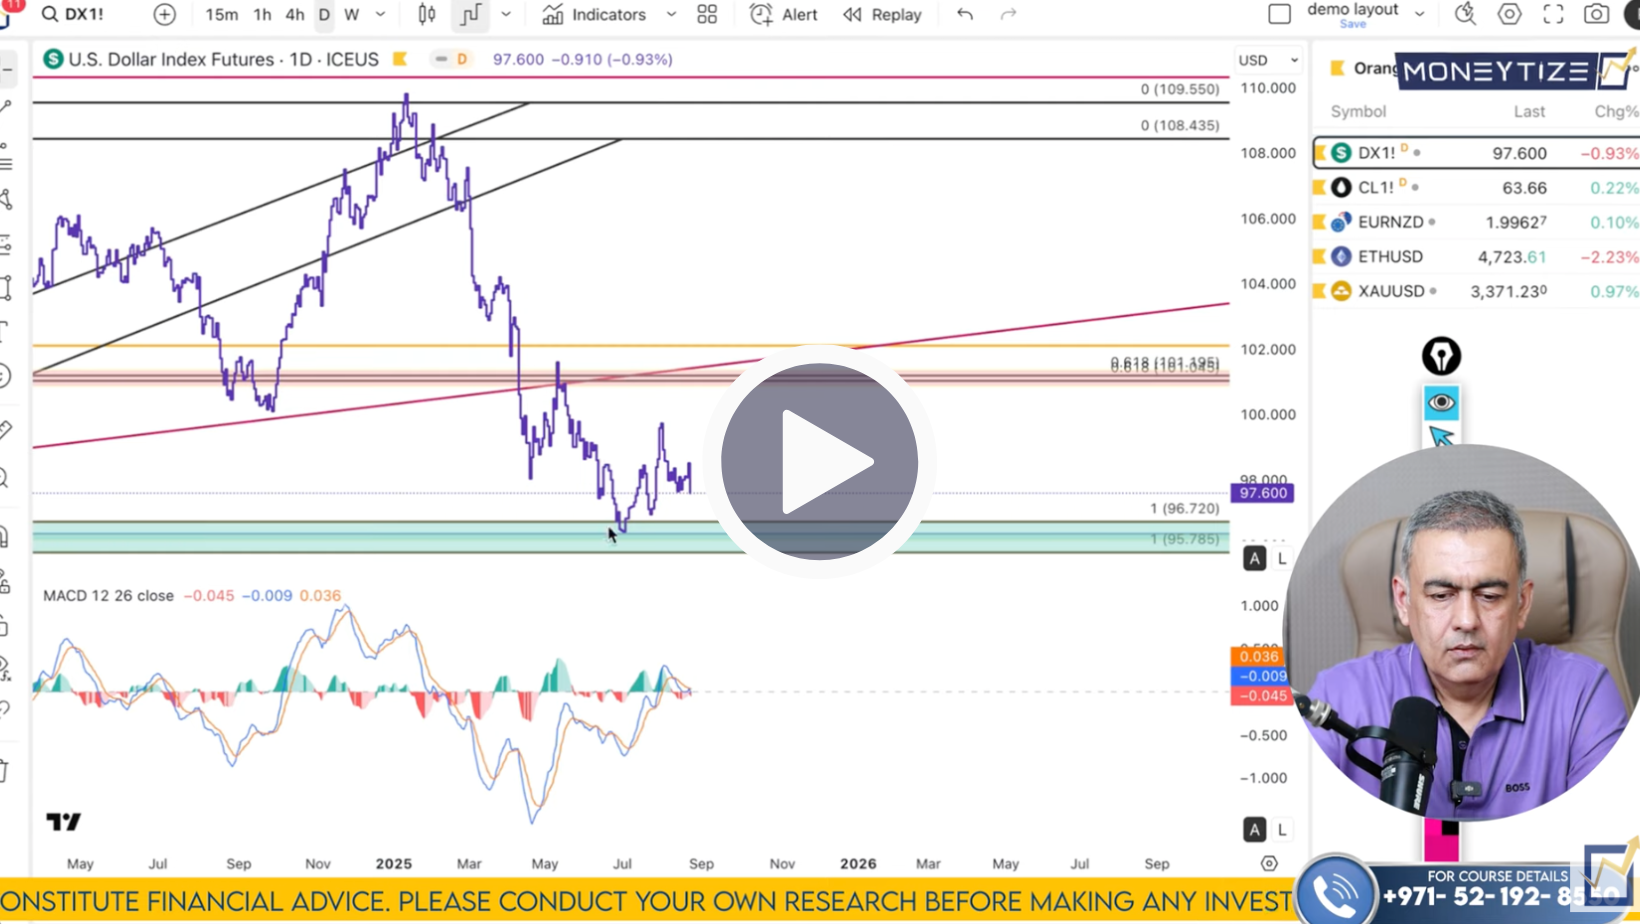
DXY (U.S. Dollar Index):
On the monthly chart, DXY has breached a rising trend line and is trading below a bearish magnet formed via confluence of Fibonacci extensions, a sign the trend may be shifting down. Weekly analysis confirms the magnet resistance between 101.04 - 101.19, while daily and 4-hour charts align with a bearish bias, targeting 96.56 - 96.72 as the nearest zone, and 95.78 beyond that. Nikkhil expects continued weakness, setting the stage for longs in dollar‑paired currencies.
Crude Oil (CL):
Crude’s monthly chart reveals buyers regaining control after a false breakdown at the 78 - 85 Fibonacci zone, accompanied by bullish divergence and a broken falling trend line, suggesting the upside remains intact. Weekly confirms the support area at 57.72, while daily and 4-hour frames reveal bullish divergence and structurally confirmed breakout levels. Targets begin at 67.50 - 69.98 ($70) and extend to 71.50, provided support around 59.49 - 59.50 holds. This setup favors “buy the dip” plays.

EUR/NZD (Euro vs. New Zealand Dollar):
EUR/NZD shows powerful multi-timeframe bullish alignment. Monthly charts display repeated bullish cycles with strong support at 1.9692 and resistance in the 2.0105 range. Weekly confirms the magnet resistance spilling into 2.0304, and daily highlights key dip-buy zones around 1.9660 to 1.9318. The 4‑hour chart remains cleanly bullish, higher highs and lows with no divergence. In short, we’re watching for pullbacks into these levels as attractive buying opportunities.

Ethereum (ETH/USD):
Ethereum trades at a make‑or‑break zone on the monthly chart; after a strong run, the next major resistance lies near the 6,000 mark. Weekly highlights strong support between 3,275 - 3,457. On the daily, ETH recently hit the 200% Fibonacci extension around 4,932, and while a near-term pullback is possible, higher timeframes remain bullish. Nikkhil’s plan? Accumulate dips toward 3,570 - 4,000, targeting a bull run back up to 6,000.

Gold (XAU/USD):
Gold maintains a strongly bullish longer-term structure even as weekly divergence shows slight weakness. Watch for pullbacks, not reversals. On daily charts, the rising trend line has held, and Fibonacci magnet resistance sits at 3,435, with support nearer 3,301. The 4‑hour frame reveals buyers retaking control, bouncing off support and triggering a breakout toward 3,390 and then 3,411 - 3,435. Until we see a move below 3,330, the plan is to continue buying dips.

This week is about precision: ebbs in the Dollar, rally setups in Crude, EUR/NZD, Ethereum, and continued structure in Gold all offer high-probability opportunities.
Stay patient. Stay prepared. The levels are alive and the moves are coming.
Click Here To Watch The Full Moneytize Forecast
We’ll talk soon
Team Moneytize