

Gold Hit New Highs, Then Blinked. Consolidation — or the First Crack?
Gold closed the week at 4,375, and last week's playbook delivered exactly as scripted. CPI landed dead on expectations at 3.4%, PPI cooled right behind it, and gold did what soft inflation data invites — it tore through 4,371 to fresh highs. Then Friday flipped the mood: price faded off the highs as traders booked profits into the close.
So the question is no longer about the data behind us — it's about what comes next. Fed dissent is building, rate-cut odds are shifting almost by the day, and Jackson Hole is dead ahead. Is this a pause to consolidate before the next leg up, or the first crack in the rally? Today's map runs through the dollar and silver, then gold — with the exact levels that answer it.

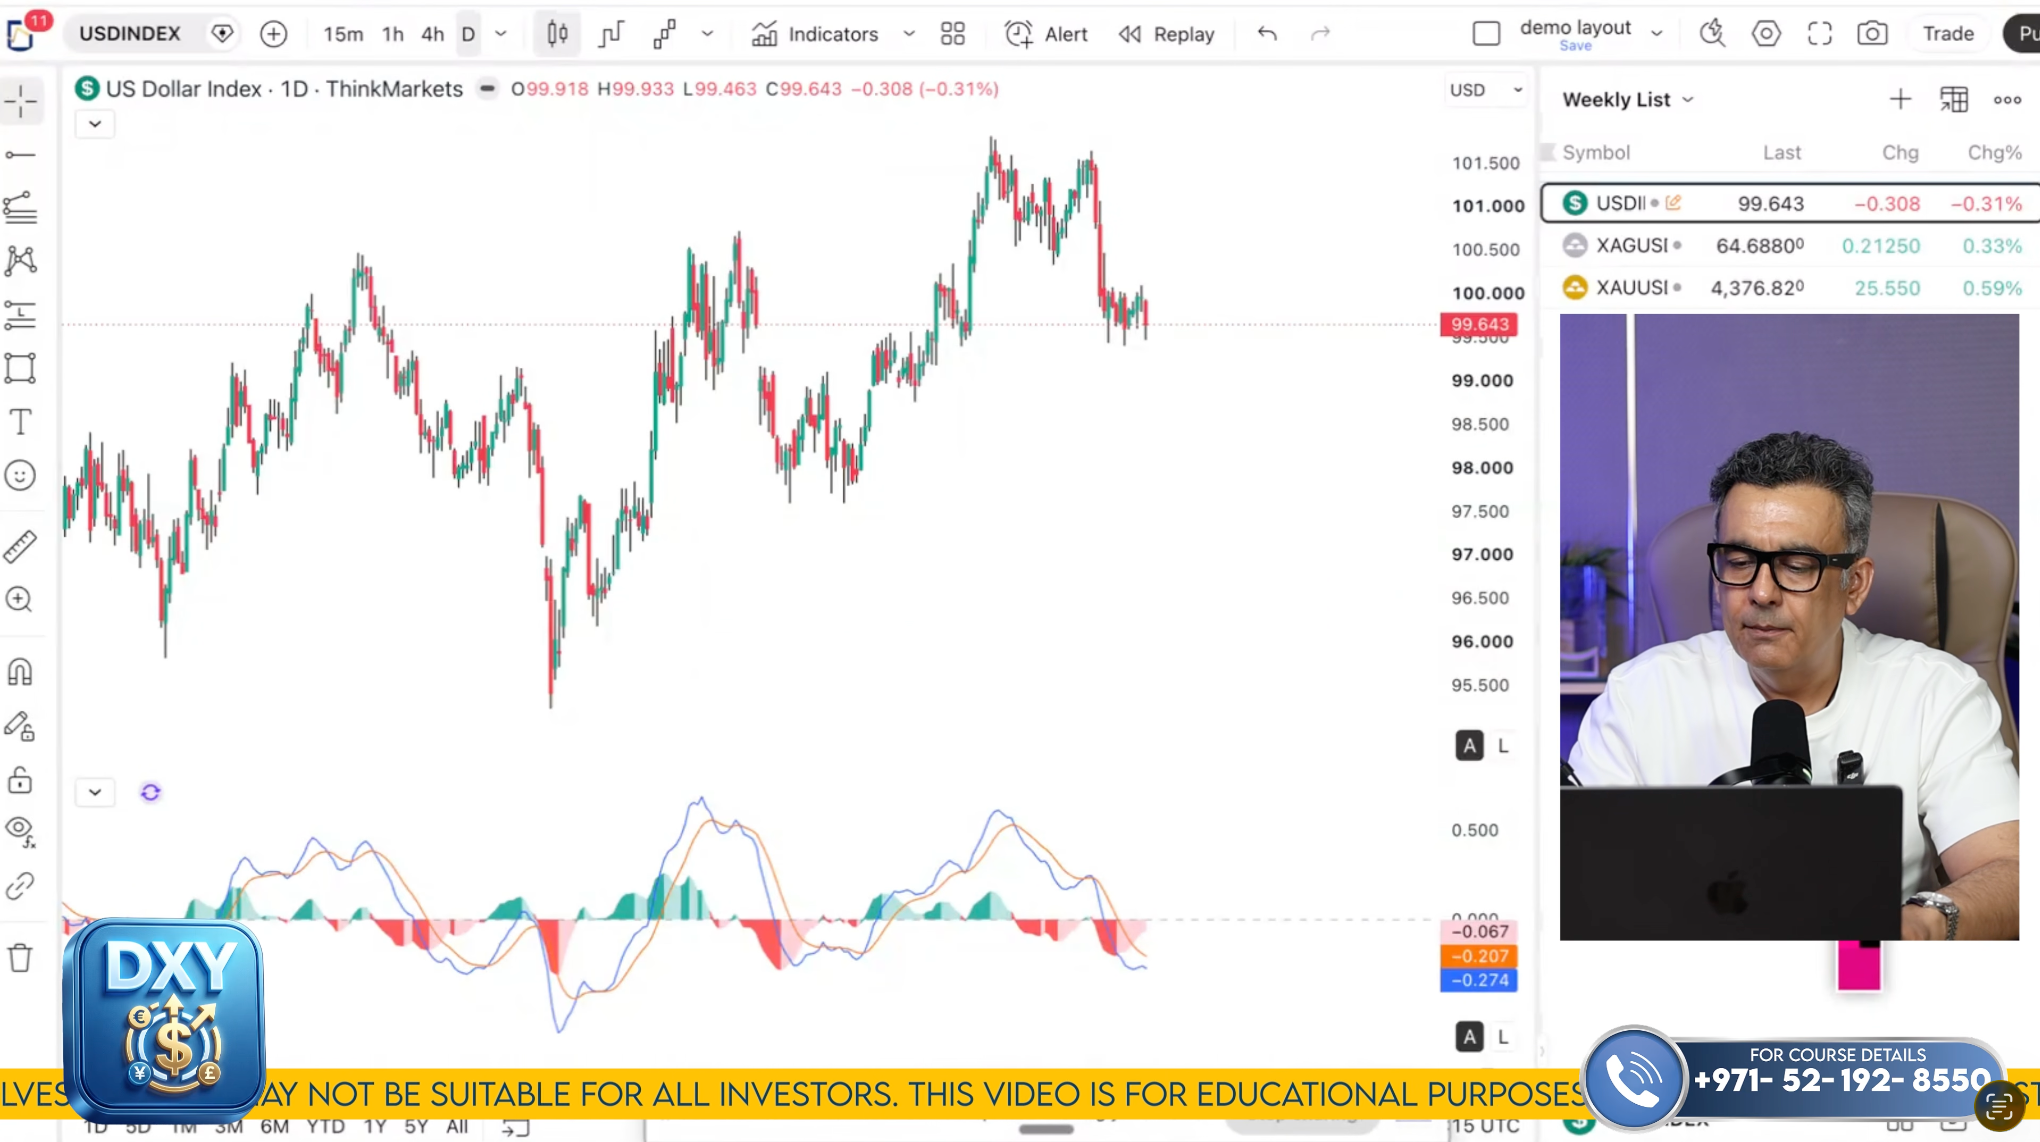
DXY - Dollar Index
The dollar is coiled in a sideways range with a downward lean. On the daily, price made a false high and rolled into a lower high, leaving resistance overhead at 100.15 and a near-term path that points lower — toward 99.23, with the deeper objective in the 78–85% retracement zone. The four-hour and hourly show the same: a bearish sequence that has flattened into consolidation, which Nikkhil reads as a short-lived pause before another leg down.
His primary expectation is a move into the 1.61 extension, a false break, and then a short-term bounce. Only a clean break above 100.15 flips that — and even then he'd expect the rally to stall near 101.20 before resuming lower. For gold, a soft dollar here is the supportive backdrop; the risk is the bounce he's flagging.
XAGUSD (SILVER)
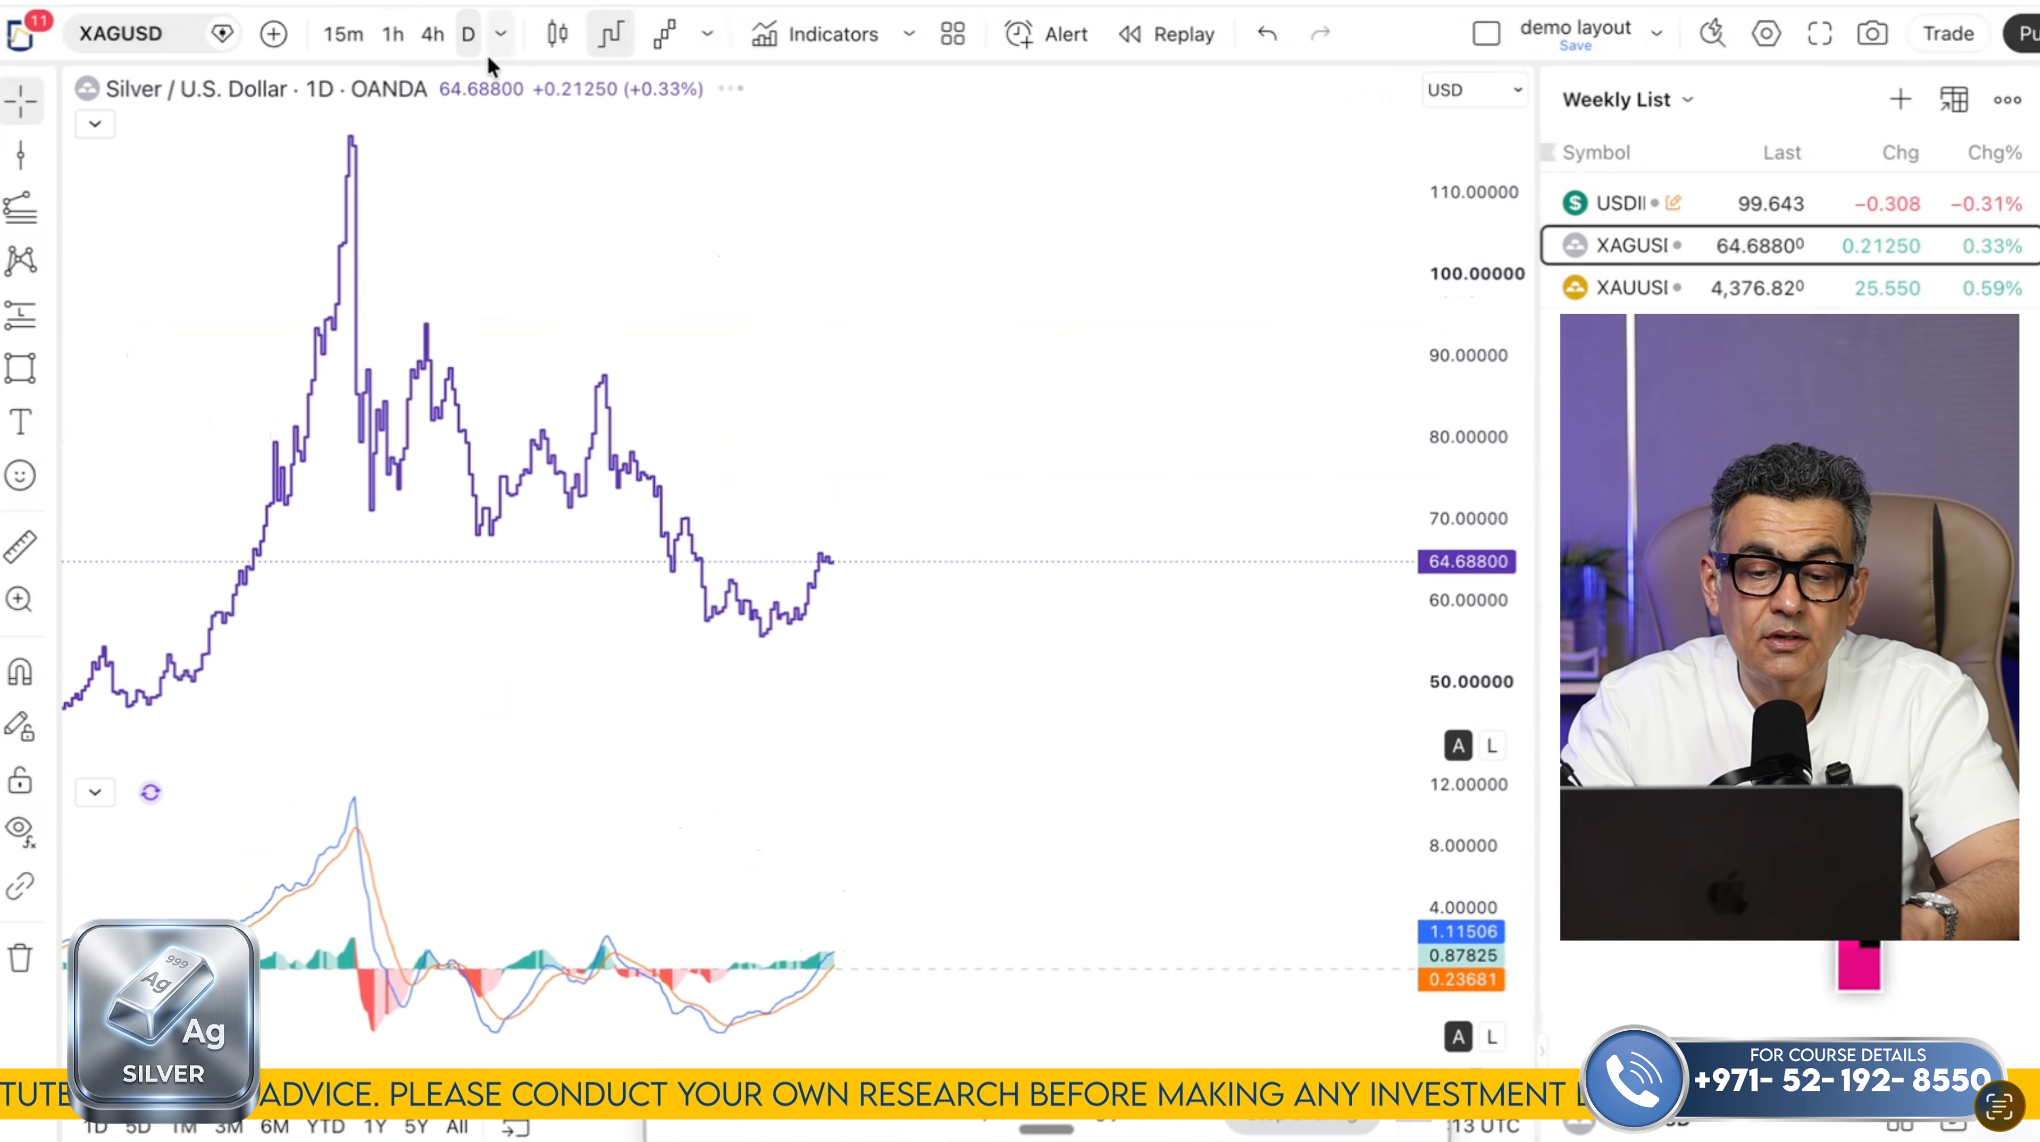
Silver broke out to the upside as its sellers exhausted, but it's already tipping its hand for a breather. On the four-hour it tagged the 1.618 extension at 66.48 almost exactly and got rejected — not a reversal, in Nikkhil's read, but a very probable short-term correction. The line that keeps that correction thesis alive is 66.10–66.32: as long as silver stays below it, he expects a pullback rather than a straight continuation.
Closest support is 62.94, with the real target zone at 62.70 and then 60.34 — the pocket he expects to be tested, or briefly false-broken with bullish divergence, before the next move higher. That's Plan A, and it's where he accumulates. Plan B is the exception: a decisive break above the 85.4% level opens a direct run to 72.62.
A plan is only as good as your ability to follow it
Every trader watching has a plan. Very few have a system that actually enforces it when the pressure hits — and weeks that push to new highs and then fade are exactly when that gap costs the most.
That's what TRADECHECX does. It connects to your MT4 or MT5, locks your account the moment your loss limit is breached, protects your profits once you reach target, and rates your discipline from 300 to 850 with a TRADESCORE.
To Avail Tradechecx 28 days Free Trial Click the link - https://score.tradechecx.com.
XAUUSD (GOLD)
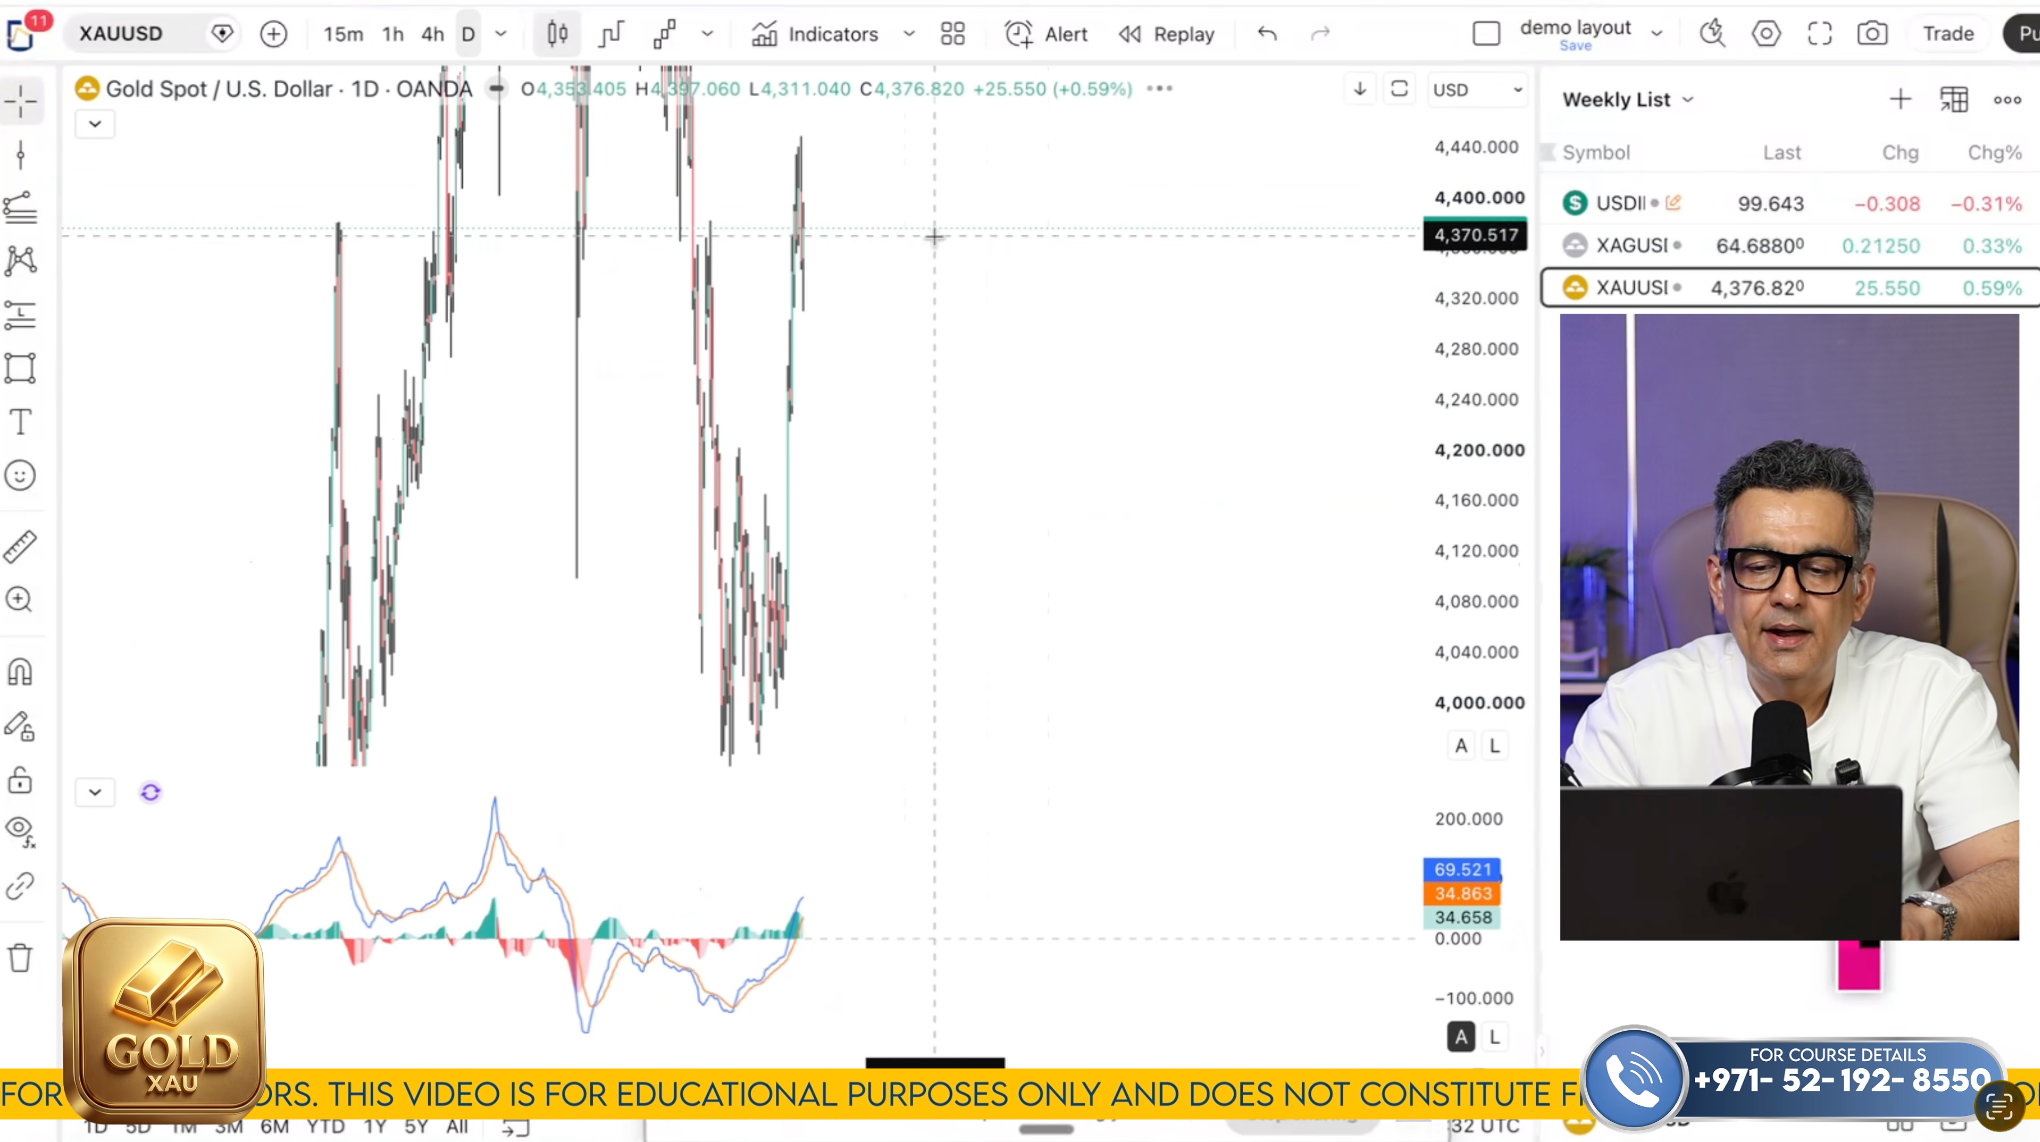
The bigger structure runs from the 4,890 high down to the 3,941 low, and the rally off that base is what carried price to last week's highs. Here's the detail that matters: in the prior weekly video, Nikkhil flagged that any move above 4,380 would be a false breakout — and that's precisely how it played out. Price poked above, the highs proved temporary, structure broke, and the first leg down carried into support around 4,325.
That sets up the week's decision cleanly. Overhead resistance sits at 4,402–4,404 and again at 4,420–4,429. Below, the support cluster Nikkhil is watching is 4,231–4,219, with a deeper pocket at 4,198. His base case is the shakeout-first path: the current bounce is likely short-lived, possibly stretching to 4,402–4,404 or a touch higher into 4,420–4,440 before rolling over into the next leg down. He's explicit that he won't add buys at current levels — he's waiting for the drop into 4,231–4,219 (with 4,263 a first marker on the way) to accumulate.
The other side of the trade is just as defined. If buyers instead break and hold above 4,420–4,429, he'd add small long positions and turn his attention up toward 4,484–4,503 and eventually 4,531. Either way, the instruction is patience: let price show its hand around the highs before committing.
What to Watch This Week
Coming up: the midweek review is on. Nikkhil returns Wednesday — and with Jackson Hole approaching, that update carries extra weight.
Soft CPI and PPI did their job: gold printed new highs. But Friday's fade said the market wants to pause and digest before it decides the next move. The rally isn't broken — the question is only whether gold pushes to fresh highs from here or shakes out one more time first. The discipline is to watch the reaction around the highs, treat 4,231–4,219 as the place to accumulate, and let Jackson Hole set the tone.
The full breakdown is live on the Moneytize YouTube channel, and this Telegram link gets you into the group for real-time updates through the week.
— The Moneytize Team