

This week’s market setup is anything but simple. Rising geopolitical tension is feeding uncertainty, fear is starting to creep into risk sentiment, and that is usually where traders get caught leaning the wrong way. On top of that, we have high-impact U.S. data ahead, including GDP and inflation numbers, which could inject real volatility across the dollar, metals, and energy. In this week’s official Moneytize forecast, Nikkhil maps out the major levels and structure behind DXY, EURUSD, crude oil, silver, and gold so you can approach the week with clarity instead of reacting late.
DXY (Dollar Index)
On the U.S. Dollar Index, Nikkhil’s view remains constructive while price holds above the key support zone around 98.90 to 99.00. Even though bearish divergence is visible, the sellers have still not completed the break of structure needed to confirm a reversal. That keeps the short-term bias pointed higher for now. On the higher time frames, DXY is sitting above an important local support magnet near 98.91 to 99.00, while resistance overhead begins around 100.03 to 100.17. If buyers can break and hold above that area convincingly, Nikkhil is watching for continuation toward 101.04 to 101.09, then 101.74, 102.00, and potentially 102.79. Fundamentally, the stronger-than-expected U.S. jobs data has only added to that bullish case, so both the technical and macro backdrop continue to favor dollar strength unless price closes back below 98.90.

EURUSD
That stronger dollar continues to keep pressure on EURUSD. Nikkhil’s structure here remains bearish across the higher time frames, with rallies still being treated as selling opportunities unless the market can break materially above the invalidation zone. On the weekly chart, major resistance sits higher up, but on the nearer-term structure the pair is already showing weakness, with the sellers pressing price toward an important support magnet near 1.1390. Below that, the next downside levels Nikkhil is tracking are 1.1227 and 1.1151. The key point is that any bounce while price remains below 1.1653, and especially below 1.1750 to 1.1755, is still seen as corrective rather than bullish.
On the four-hour chart, even where short-term bullish divergence appeared, buyers still failed to complete a proper break of structure. That tells Nikkhil the bounce is not yet a trend change. Instead, it keeps the larger bearish sequence intact, with tighter resistance coming in around 1.1624 to 1.1653. Unless EURUSD can close above 1.1755, the broader plan remains to sell strength rather than chase upside.

Crude Oil
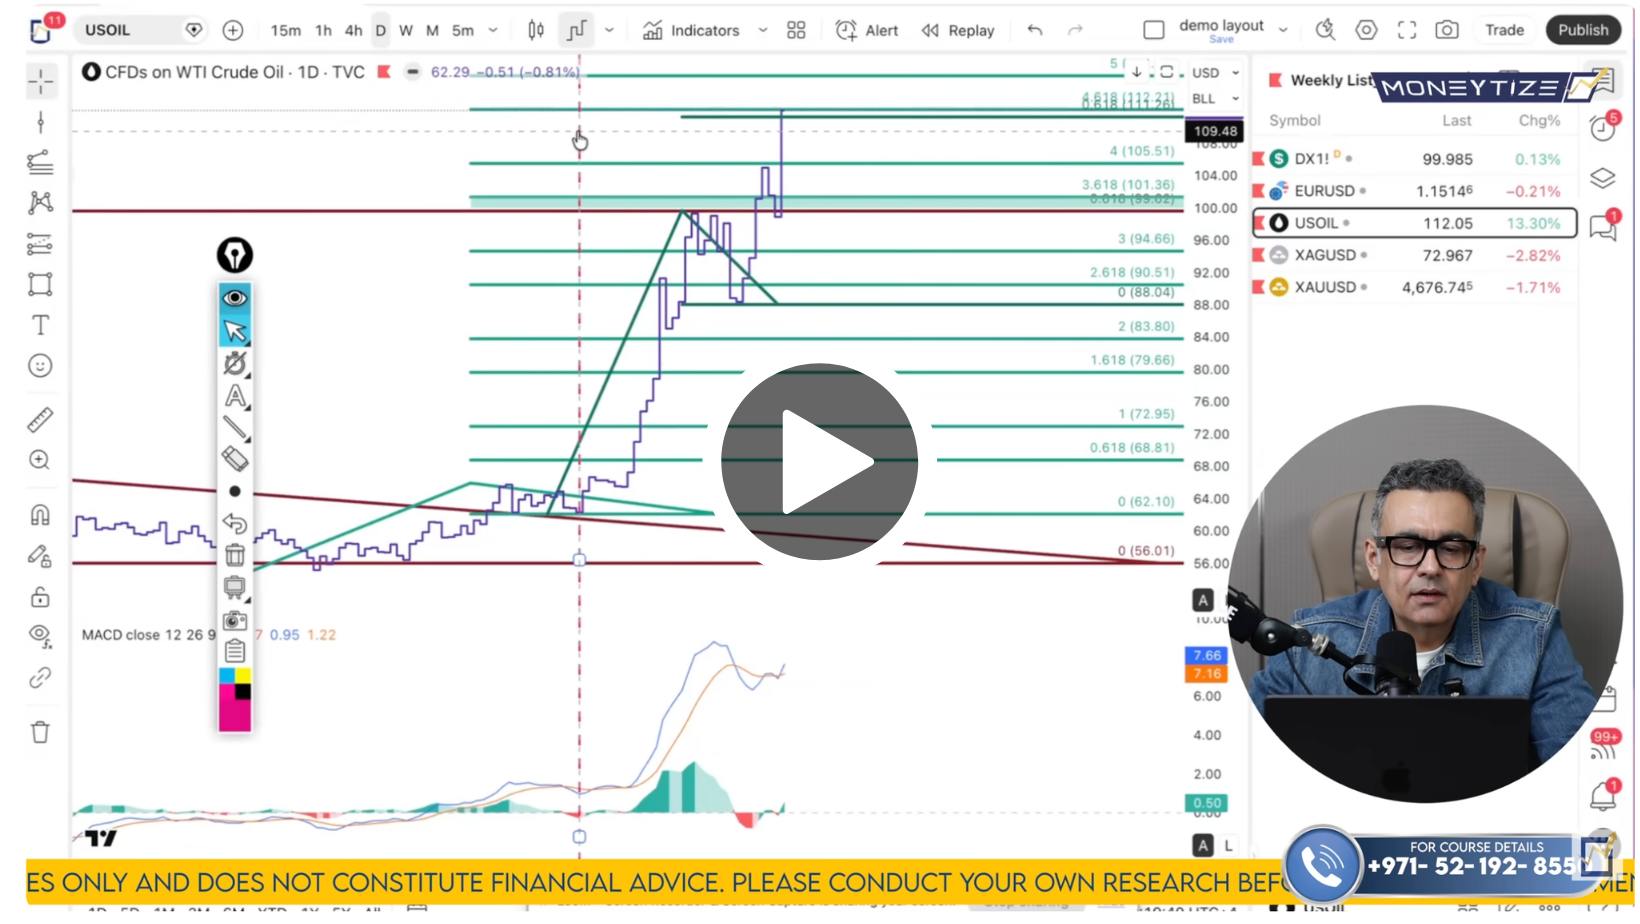
Crude oil remains one of the clearer bullish structures on the board. Nikkhil’s analysis shows that price has already broken out, retested, and bounced from a major support zone, which keeps the upside case in play. On the daily chart, that broader support region sits around 99.6 to 101, while current structure shows price trading into a nearer-term resistance zone around 111 to 112.21. Buyers need to clear and hold above that area first, but as long as the broader trend remains intact, Nikkhil is looking for continuation toward 116, then the bigger magnet zone between 120 and 123.
What stands out here is that the market still is not showing meaningful bearish divergence on the higher time frames. Momentum may be fading slightly at the top on the lower time frames, which is why Nikkhil is not advising aggressive buying into resistance. Instead, he is watching for pullbacks into support as the higher-probability entry area. On the hourly chart, those support zones come in around 109.70 to 110, then 107, with deeper support around 105 to 106. As long as pullbacks remain controlled, the plan is still to buy dips and position for a move back into the higher magnet targets.
Silver (XAGUSD)
Silver is in a different phase. Rather than a clean trend leg, Nikkhil sees it in a corrective bounce after holding a key support zone. The major support around 65.26 has already proven important, with price breaking below it briefly but failing to close there before bouncing back. That rejection matters. On the higher time frames, silver has started to stabilize, and on the four-hour chart Nikkhil is seeing bullish divergence between the recent lows, which supports the case for further recovery in the short term.
That said, he is not treating this as an aggressive breakout environment yet. This is still a corrective move, which means upside targets need to be handled with more caution. As long as silver holds above 66.98, with the larger support still sitting at 65.26, Nikkhil is watching for a gradual move into 74.48, then 79.12 to 79.6, and potentially up toward the 81.77 to 83.35 region. Once price gets there, the market will need to be reassessed because that is where sellers may begin to step back in. For now, silver looks slightly stronger than gold in the short term, but it is still a bounce until proven otherwise.

Gold (XAUUSD)
Gold is where the biggest decision point may be forming this week. Nikkhil opened the forecast with it for a reason: traders need to know whether this market is offering a discount or setting up the next leg down. On the weekly chart, gold is showing loss of bullish momentum through bearish divergence, but the full break of structure has still not happened. That level sits much lower, so the bigger reversal case is not confirmed yet. On the daily and intraday structure, gold is currently in a corrective bounce - a relief rally inside a broader vulnerable backdrop rather than a clean trend continuation.
That makes the nearby zones especially important. On the four-hour chart, gold is trading below a major resistance band between 4691 and 4729, while support sits around 4577 to 4582, with deeper protection lower at 4434 to 4463. Nikkhil’s plan is clear: if buyers can break and hold above 4729, then upside opens toward 4855, 4909, and eventually the 5018 to 5036 region. But if price loses 4434 on a closing basis, the corrective bullish plan is invalidated and the market becomes vulnerable to a deeper leg lower. In other words, gold is bouncing, but it is not yet free and clear. This is the zone that decides whether buyers are building a real recovery or simply setting up a better price for sellers to strike again.

The levels are live.
The moves are coming.
Watch the full breakdown now and get your plan in place before the herd reacts.
Click here to watch the full Moneytize Forecast
We’ll talk soon
Team Moneytize